更多SpringBoot3内容请关注我的专栏:《SpringBoot3》
期待您的点赞👍收藏⭐评论✍
重学SpringBoot3-集成Spring Boot Actuator
Spring Boot Actuator 是 Spring Boot 提供的一组内置功能,用于监控和管理应用程序。通过 Actuator,开发者可以轻松获取应用的运行时状态,执行健康检查,监控性能指标,甚至自定义端点来满足特定需求。本文将详细介绍如何在 Spring Boot 3 中整合 Spring Boot Actuator,并展示如何配置和使用 Actuator 提供的核心功能。
1. 什么是 Spring Boot Actuator?
Spring Boot Actuator 是一组能够帮助我们监控和管理 Spring Boot 应用的工具。它提供了很多有用的端点,用来查看应用的各种信息,如健康状况、Bean 信息、应用配置、日志级别等。Actuator 默认提供了一些内置的端点,但我们也可以根据需求自定义新的端点。
2. Spring Boot Actuator 的核心功能
Spring Boot Actuator 的核心功能主要包括:
- 健康检查 (Health Check):检测应用及其依赖服务(如数据库、消息队列等)的健康状况。
- 监控指标 (Metrics):收集和展示应用程序的运行指标,如内存使用、线程状态、GC 情况等。
- 应用程序信息 (Info):展示应用程序的基本信息,如版本、环境变量等。
- 审计 (Auditing):记录应用的安全事件。
- HTTP 跟踪 (HTTP Tracing):跟踪 HTTP 请求和响应。
- 日志级别管理 (Loggers):动态调整日志级别。
3. Spring Boot 3 中集成 Actuator
3.1 添加依赖
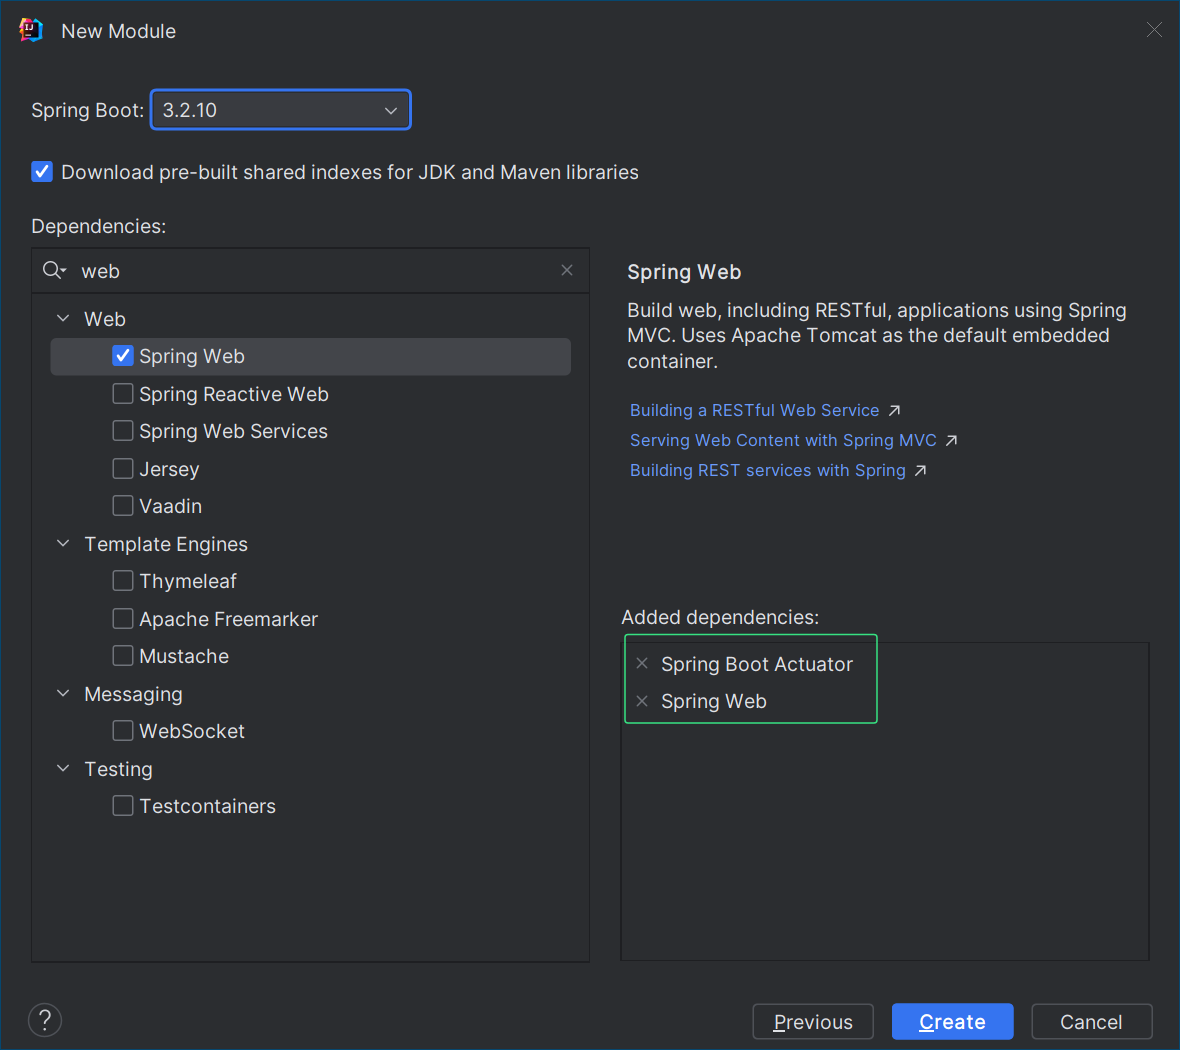
在 Spring Boot 3 项目中使用 Actuator,首先需要在 pom.xml 文件中添加相关依赖:
		<dependency>
			<groupId>org.springframework.boot</groupId>
			<artifactId>spring-boot-starter-actuator</artifactId>
		</dependency>
		<dependency>
			<groupId>org.springframework.boot</groupId>
			<artifactId>spring-boot-starter-web</artifactId>
		</dependency>
在引入 spring-boot-starter-actuator 依赖后,Spring Boot 会自动配置 Actuator 并启用其默认端点。
3.2 开启 Actuator 端点
默认情况下,Spring Boot Actuator 只开启少量的端点。我们可以通过 application.properties 或 application.yml 配置文件来自定义启用哪些端点。
在 application.yml 中,可以通过以下配置开启所有的 Actuator 端点:
management:
  endpoints:
    web:
      exposure:
        include: '*'
此配置会启用所有的 Actuator 端点。若仅希望启用部分端点,可以将 '*' 替换为具体的端点名,如:
management:
  endpoints:
    web:
      exposure:
        include: health,info
3.3 常用的 Actuator 端点
一些常用的 Actuator 端点包括:
/actuator/health:显示应用程序的健康状况。/actuator/info:显示应用程序的基本信息。/actuator/metrics:展示应用的监控指标。/actuator/loggers:查看和修改应用程序的日志级别。/actuator/env:显示应用程序的环境属性和配置信息。
可以通过浏览器或 HTTP 客户端访问 http://localhost:8080/actuator 展示出所有可以用的监控端点。
{
    "_links": {
        "self": {
            "href": "http://localhost:8080/actuator",
            "templated": false
        },
        "beans": {
            "href": "http://localhost:8080/actuator/beans",
            "templated": false
        },
        "caches-cache": {
            "href": "http://localhost:8080/actuator/caches/{cache}",
            "templated": true
        },
        "caches": {
            "href": "http://localhost:8080/actuator/caches",
            "templated": false
        },
        "health": {
            "href": "http://localhost:8080/actuator/health",
            "templated": false
        },
        "health-path": {
            "href": "http://localhost:8080/actuator/health/{*path}",
            "templated": true
        },
        "info": {
            "href": "http://localhost:8080/actuator/info",
            "templated": false
        },
        "conditions": {
            "href": "http://localhost:8080/actuator/conditions",
            "templated": false
        },
        "configprops": {
            "href": "http://localhost:8080/actuator/configprops",
            "templated": false
        },
        "configprops-prefix": {
            "href": "http://localhost:8080/actuator/configprops/{prefix}",
            "templated": true
        },
        "env": {
            "href": "http://localhost:8080/actuator/env",
            "templated": false
        },
        "env-toMatch": {
            "href": "http://localhost:8080/actuator/env/{toMatch}",
            "templated": true
        },
        "loggers": {
            "href": "http://localhost:8080/actuator/loggers",
            "templated": false
        },
        "loggers-name": {
            "href": "http://localhost:8080/actuator/loggers/{name}",
            "templated": true
        },
        "heapdump": {
            "href": "http://localhost:8080/actuator/heapdump",
            "templated": false
        },
        "threaddump": {
            "href": "http://localhost:8080/actuator/threaddump",
            "templated": false
        },
        "metrics-requiredMetricName": {
            "href": "http://localhost:8080/actuator/metrics/{requiredMetricName}",
            "templated": true
        },
        "metrics": {
            "href": "http://localhost:8080/actuator/metrics",
            "templated": false
        },
        "scheduledtasks": {
            "href": "http://localhost:8080/actuator/scheduledtasks",
            "templated": false
        },
        "mappings": {
            "href": "http://localhost:8080/actuator/mappings",
            "templated": false
        }
    }
}
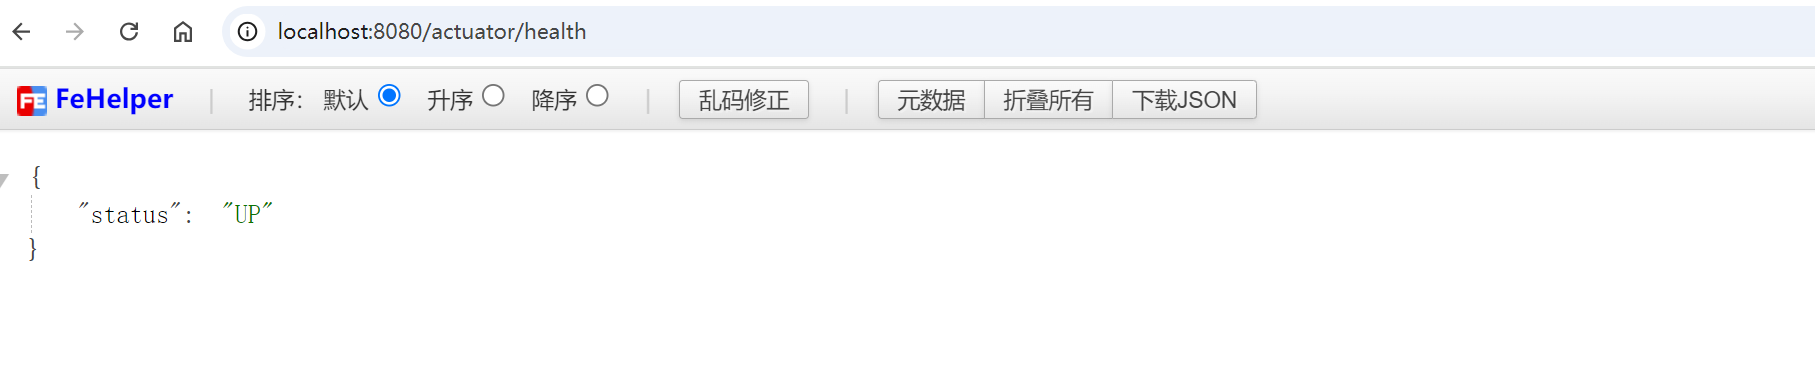
例如,访问 http://localhost:8080/actuator/health 会返回应用程序的健康信息。
3.4 健康检查 (Health Check)
/actuator/health 端点用于检查应用程序及其依赖服务的健康状况。Spring Boot Actuator 内置了一些常见服务的健康指示器,如数据库、消息队列等。
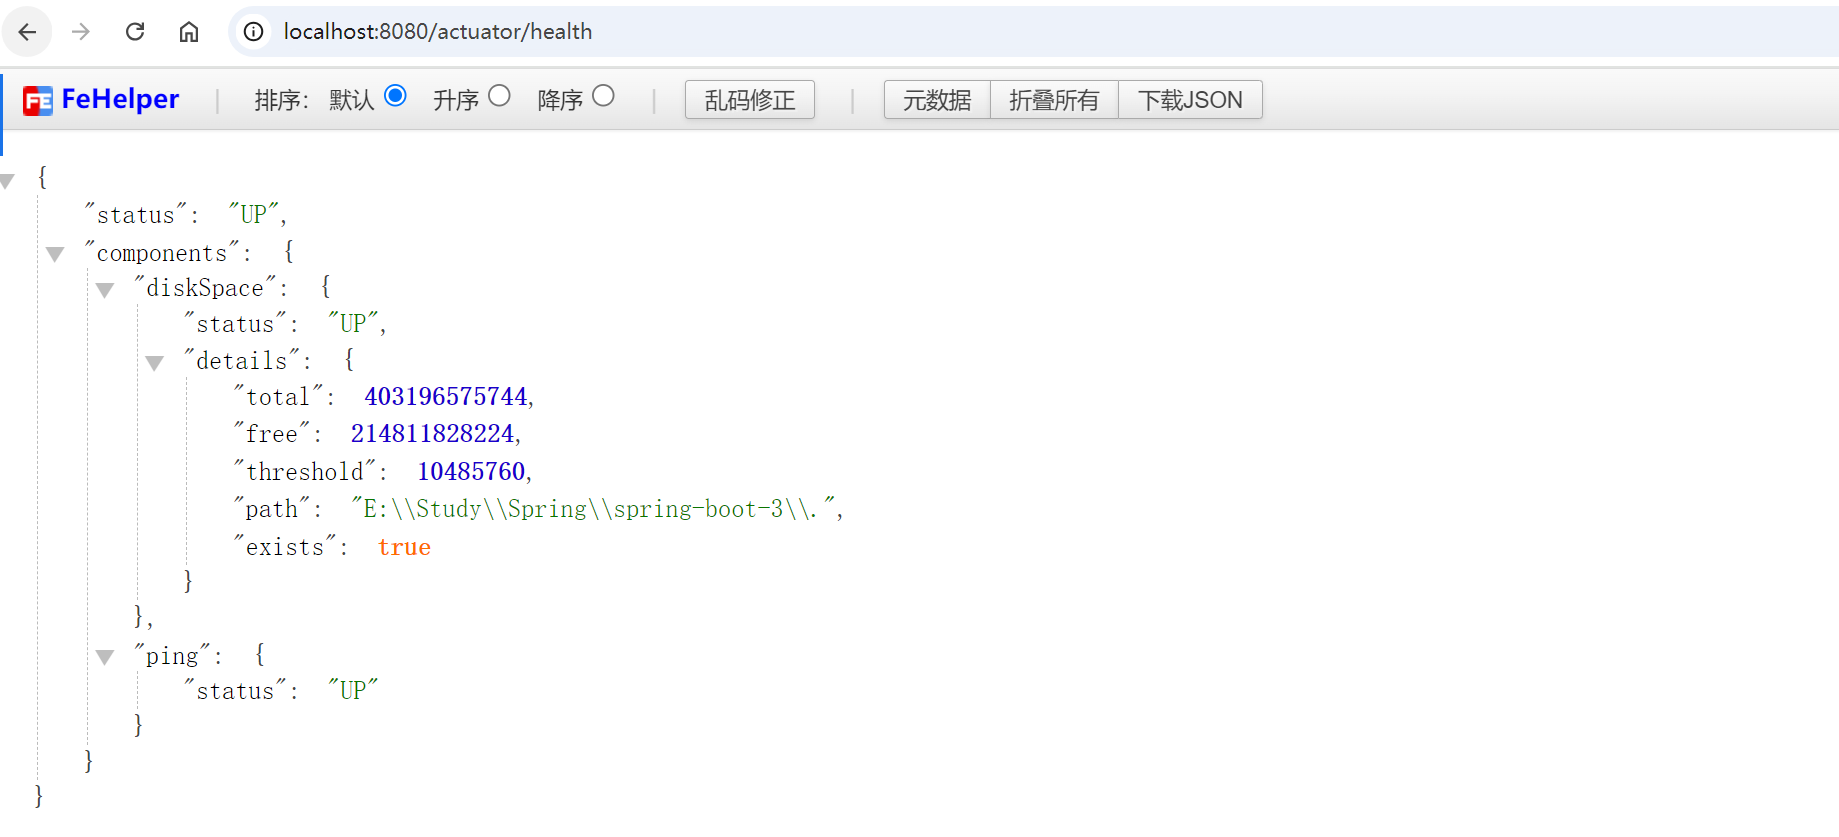
可以在 application.yml 中配置健康检查的详情:
management:
  endpoint:
    health:
      show-details: always
这将确保 /actuator/health 端点返回详细的健康检查信息。
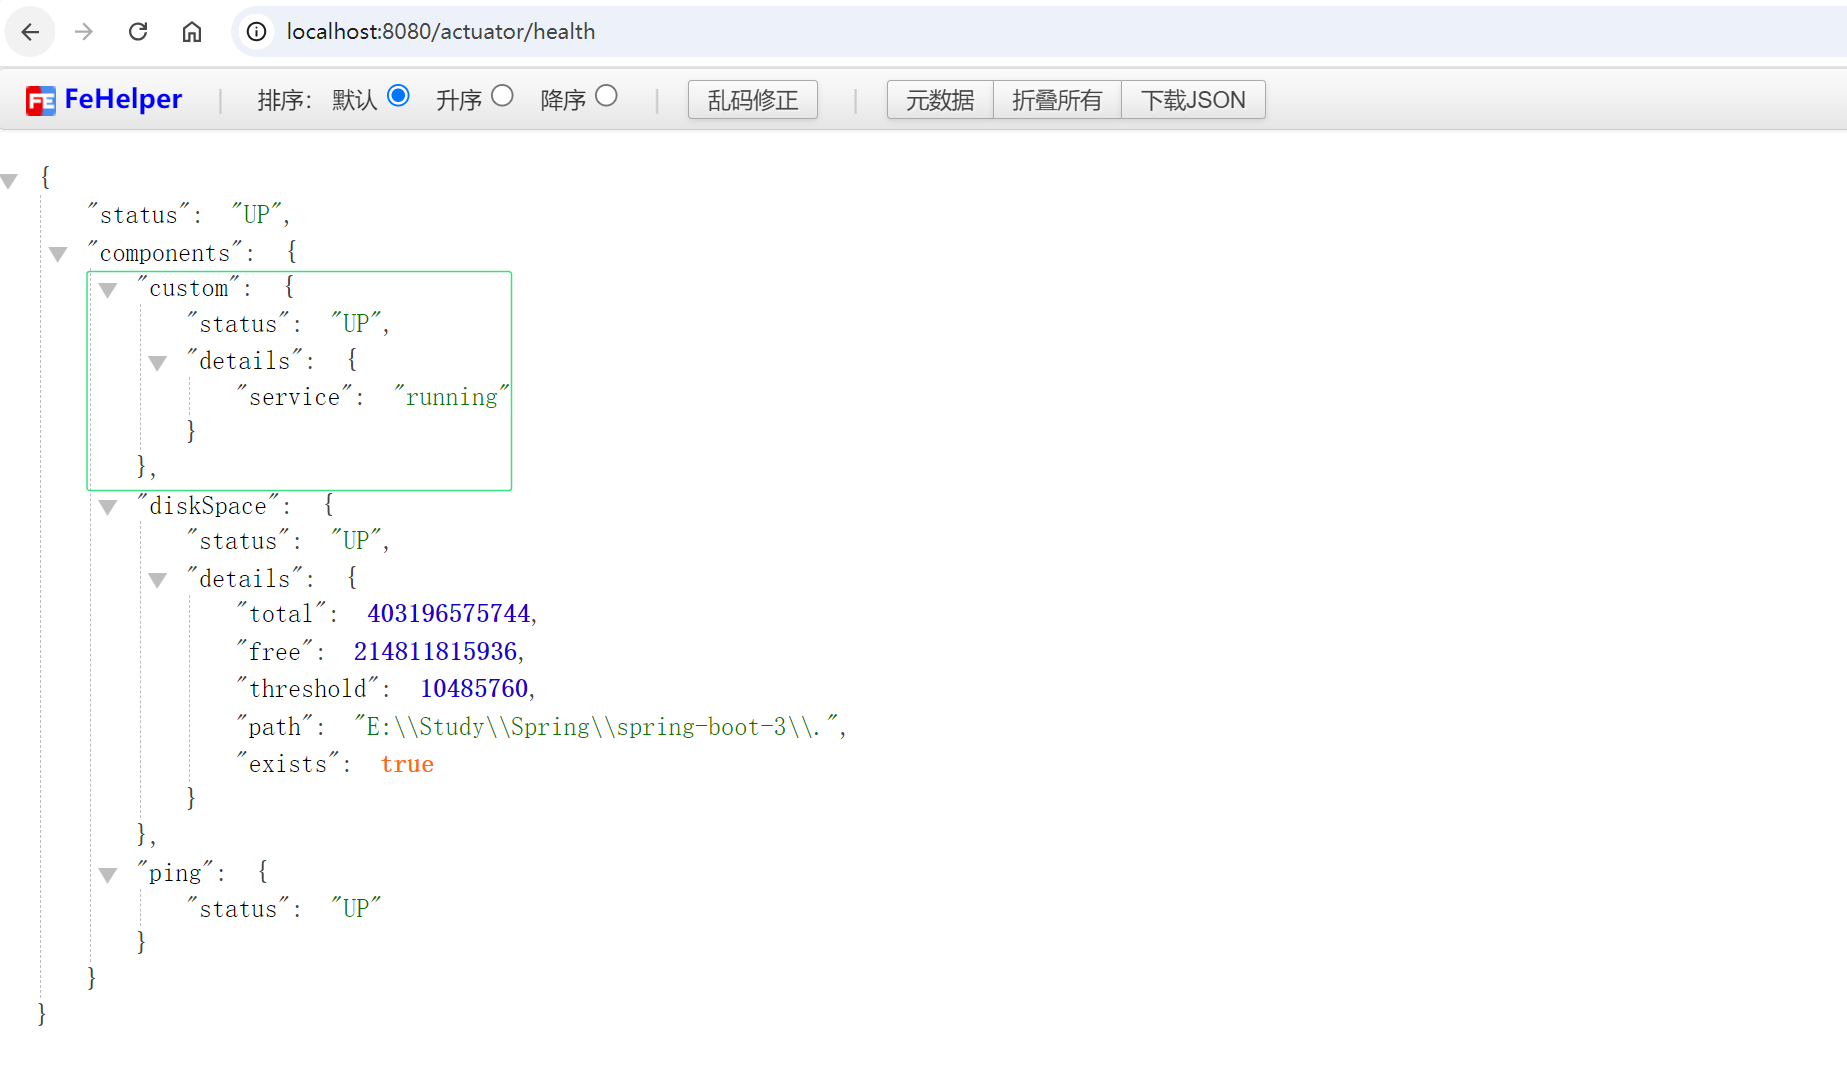
若需要自定义健康指示器,可以实现 HealthIndicator 接口:
package com.coderjia.boot3actuator.config;

import org.springframework.boot.actuate.health.Health;
import org.springframework.boot.actuate.health.HealthIndicator;
import org.springframework.stereotype.Component;

/**
 * @author CoderJia
 * @create 2024/10/13 上午 10:33
 * @Description
 **/
@Component
public class CustomHealthIndicator implements HealthIndicator {

    @Override
    public Health health() {
        // 自定义健康检查逻辑
        boolean serviceRunning = checkExternalService();
        if (serviceRunning) {
            return Health.up().withDetail("service", "running").build();
        } else {
            return Health.down().withDetail("service", "stopped").build();
        }
    }

    private boolean checkExternalService() {
        // 模拟外部服务的检查
        return true;
    }
}
访问 /actuator/health 时将会包含自定义健康检查的结果。
3.5 监控指标 (Metrics)
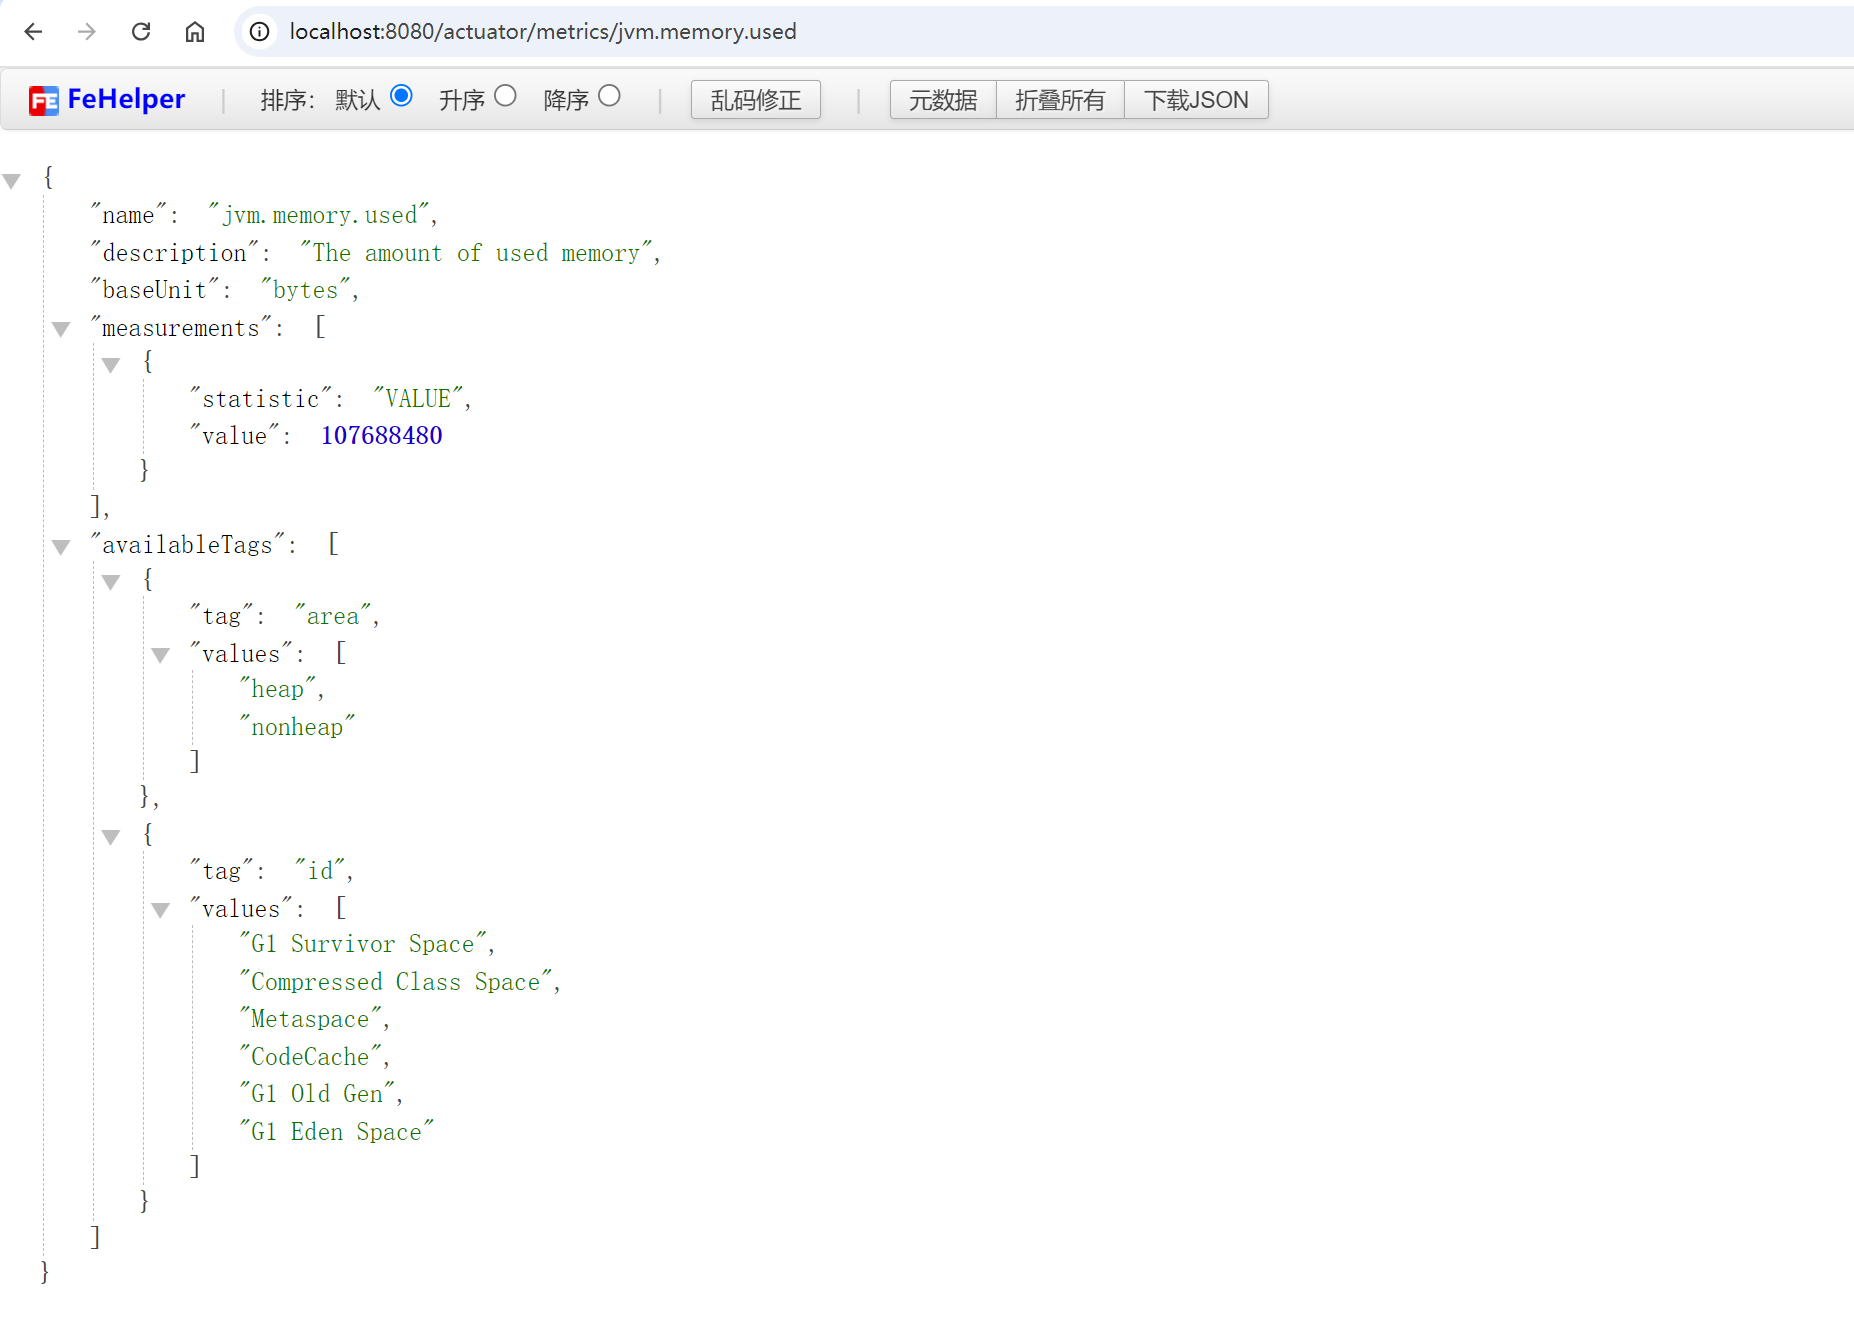
/actuator/metrics 端点可以显示应用程序的运行时指标,包括 JVM 内存使用情况、CPU 使用率、垃圾回收次数、线程信息等。
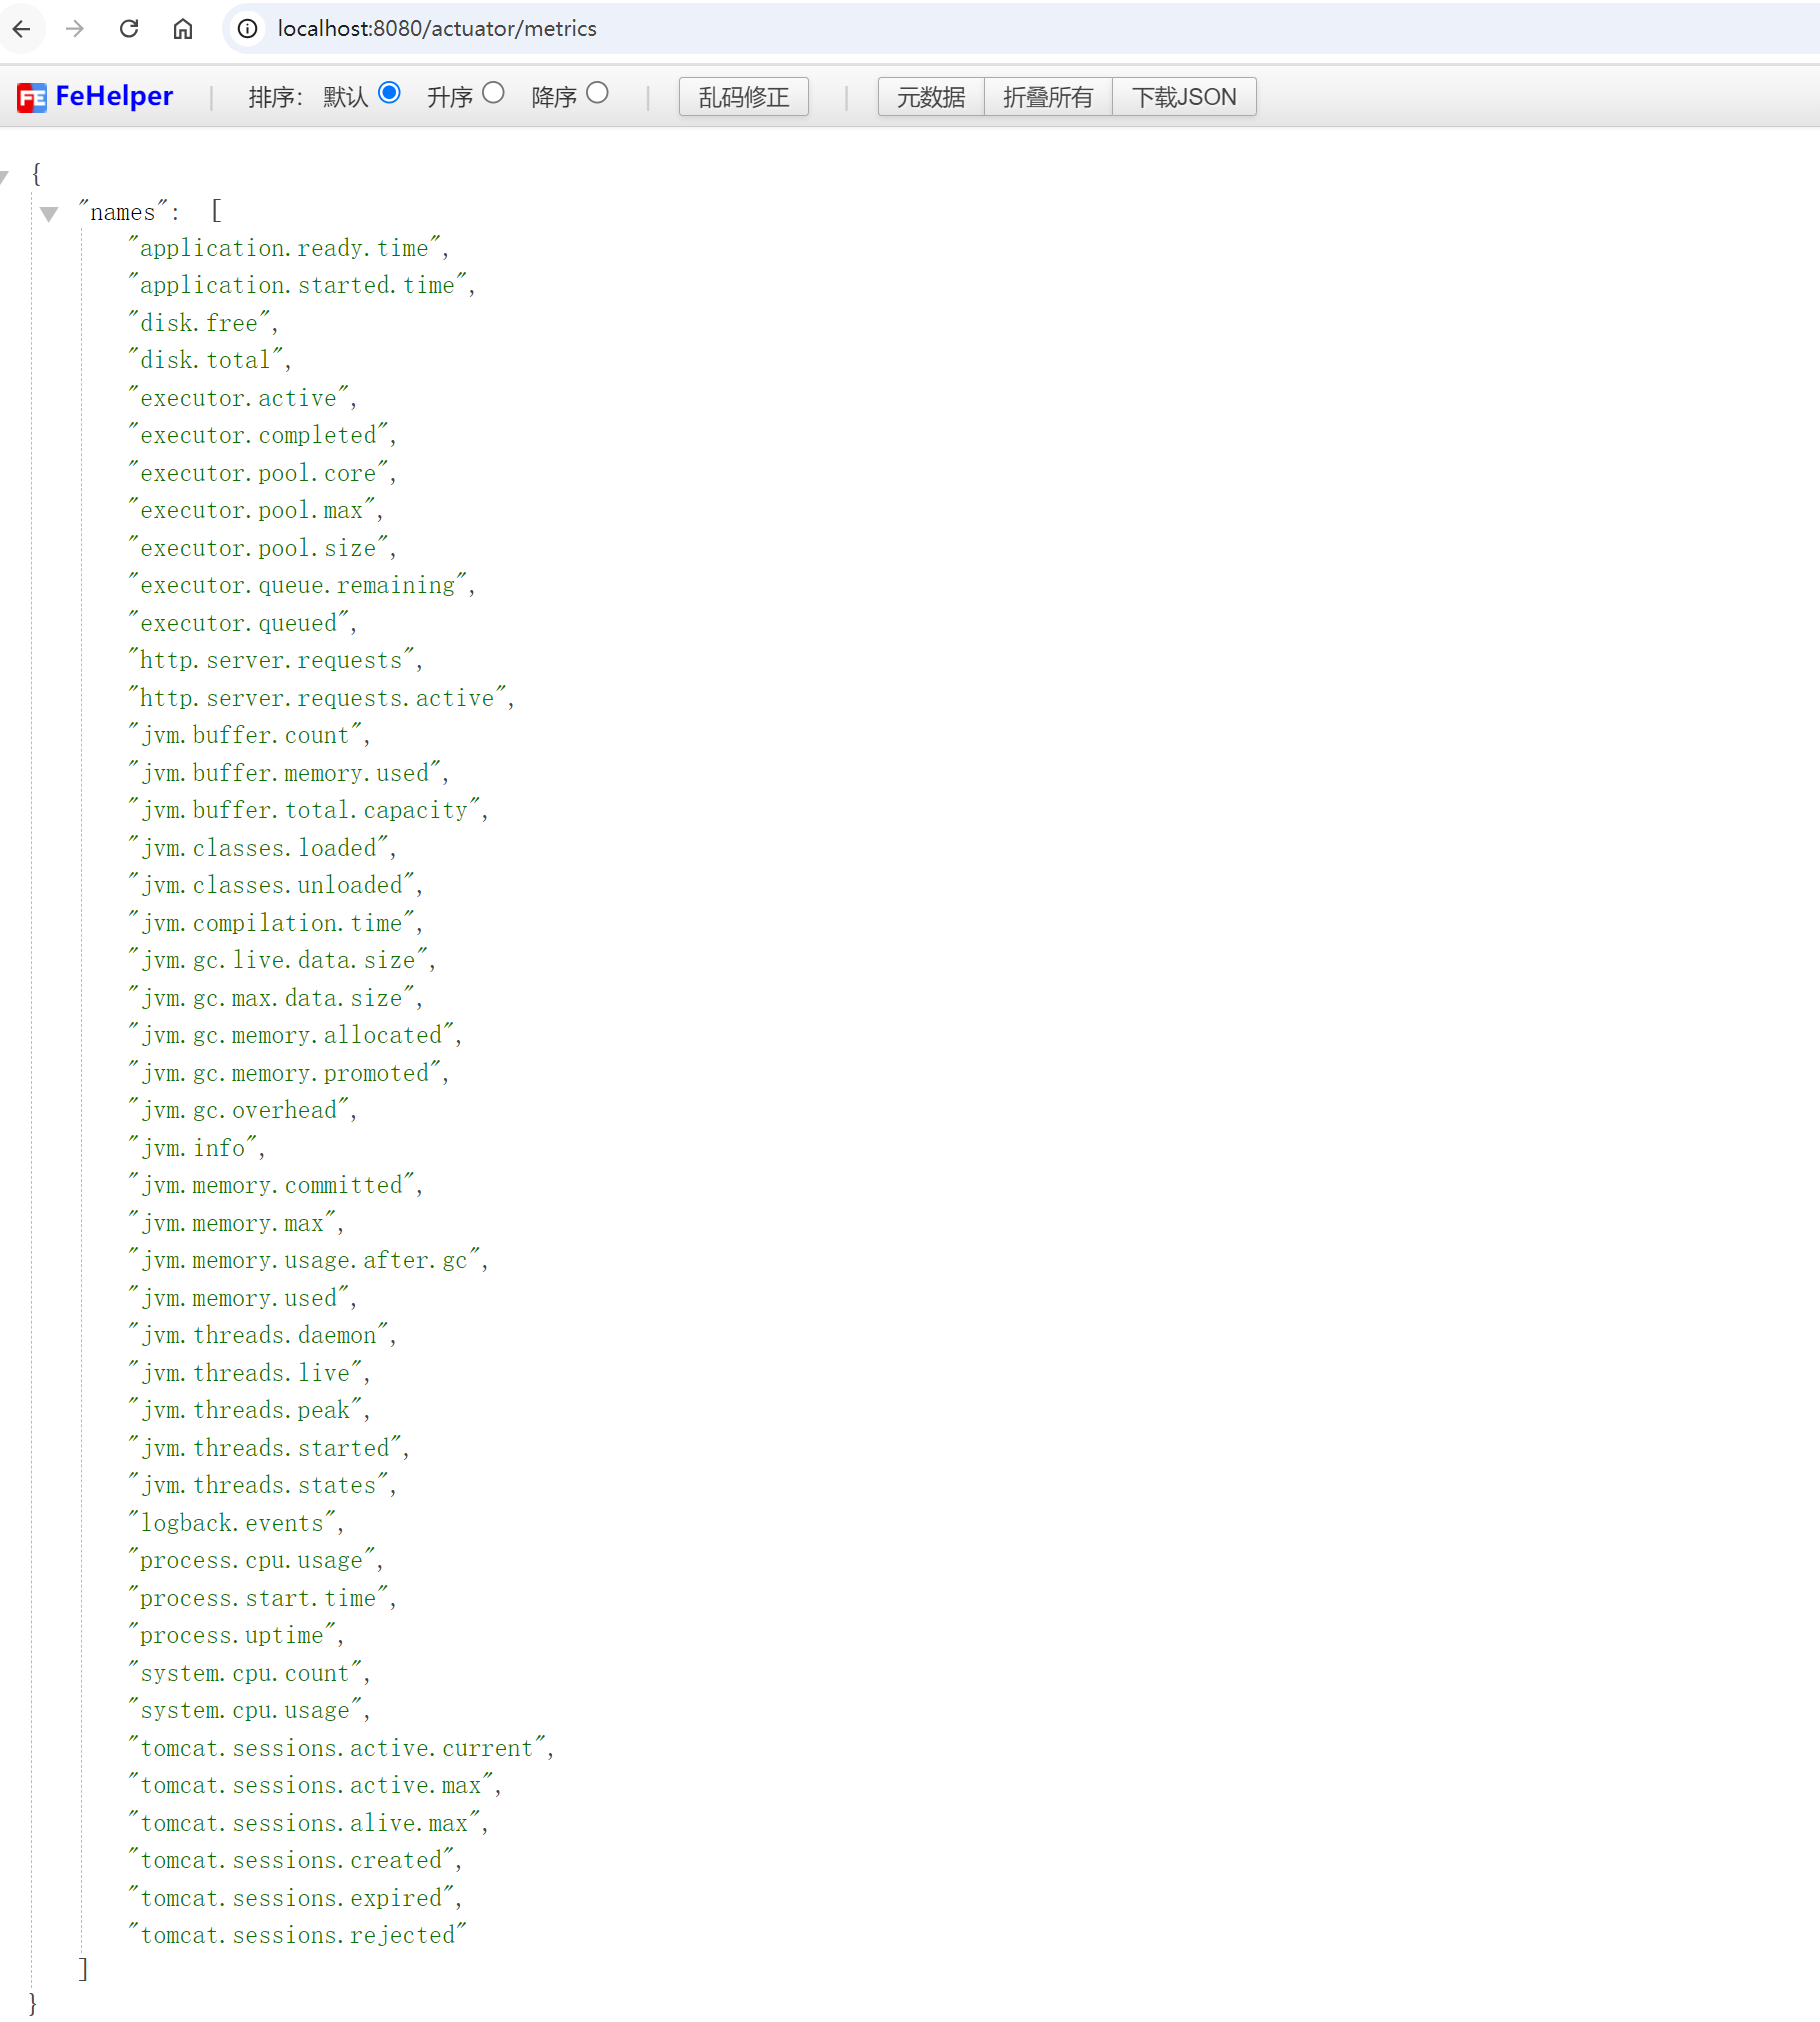
访问 /actuator/metrics 时,可以获取所有可用的监控指标。例如,要查看 JVM 内存使用情况,可以访问 /actuator/metrics/jvm.memory.used。
Actuator 使用 Micrometer 来收集和导出这些指标,Micrometer 支持多种监控系统,如 Prometheus、Graphite 等。如果你需要将指标导出到外部监控系统,可以在 application.yml 中进行配置:
management:
  metrics:
    export:
      prometheus:
        enabled: true
3.6 应用信息 (Info)
/actuator/info 端点可以显示应用程序的基本信息,如版本号、构建时间等。这些信息可以通过 application.yml 文件进行配置:
management:
endpoints:
web:
exposure:
include: '*'
info:
env:
enabled: true
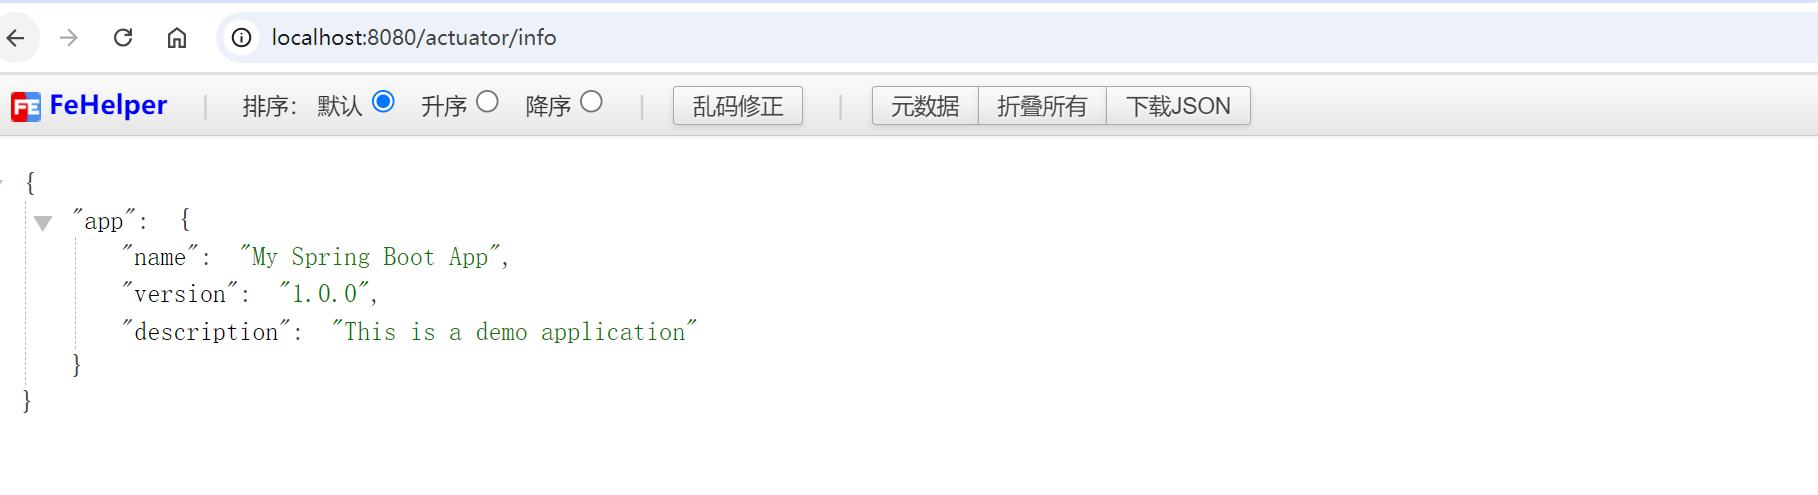
info:
app:
name: My Spring Boot App
version: 1.0.0
description: This is a demo application
访问 /actuator/info 时将返回这些配置的信息。
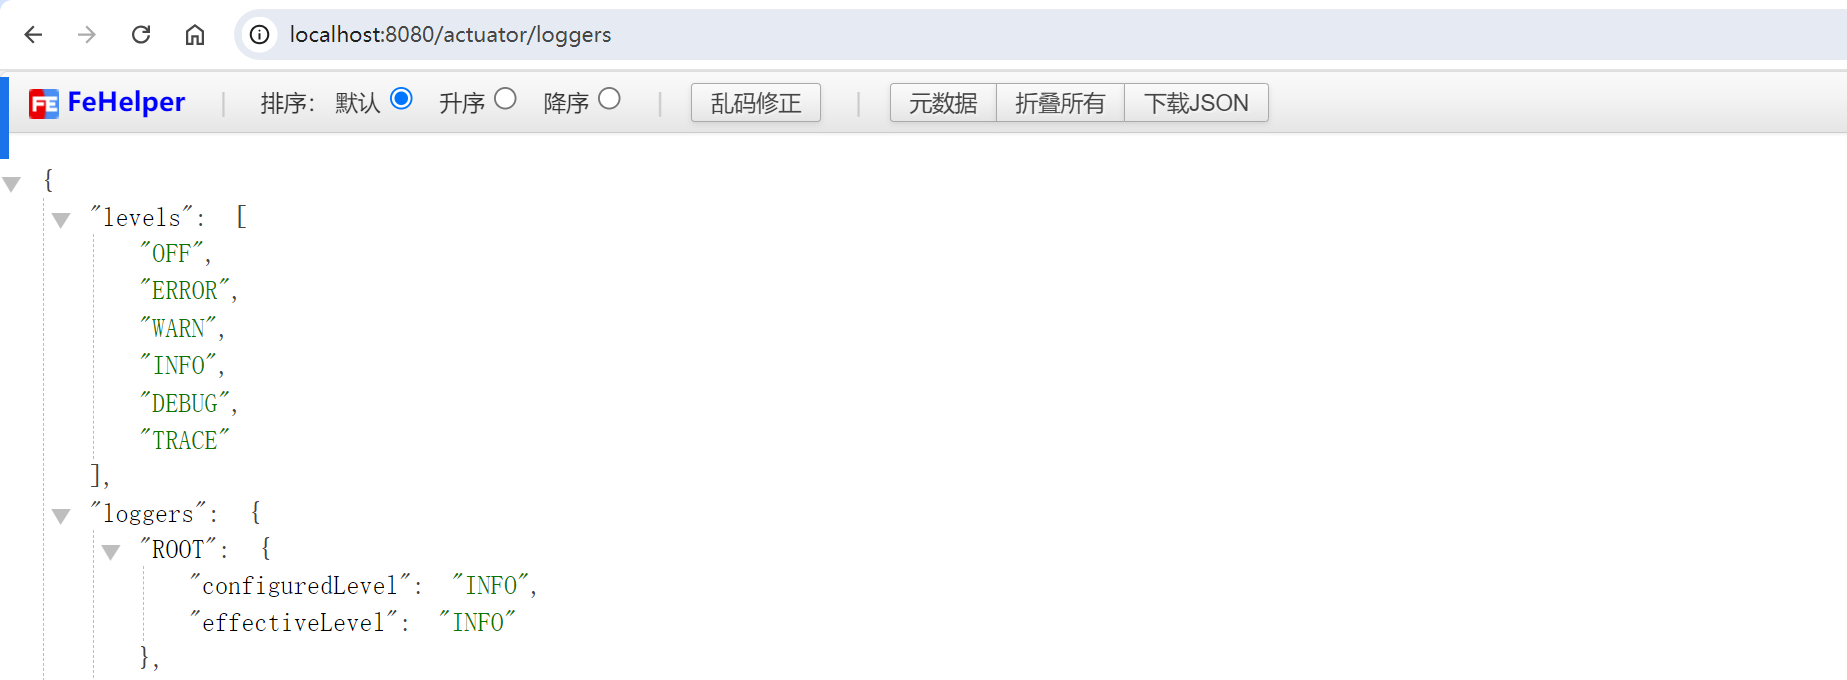
3.7 日志管理 (Loggers)
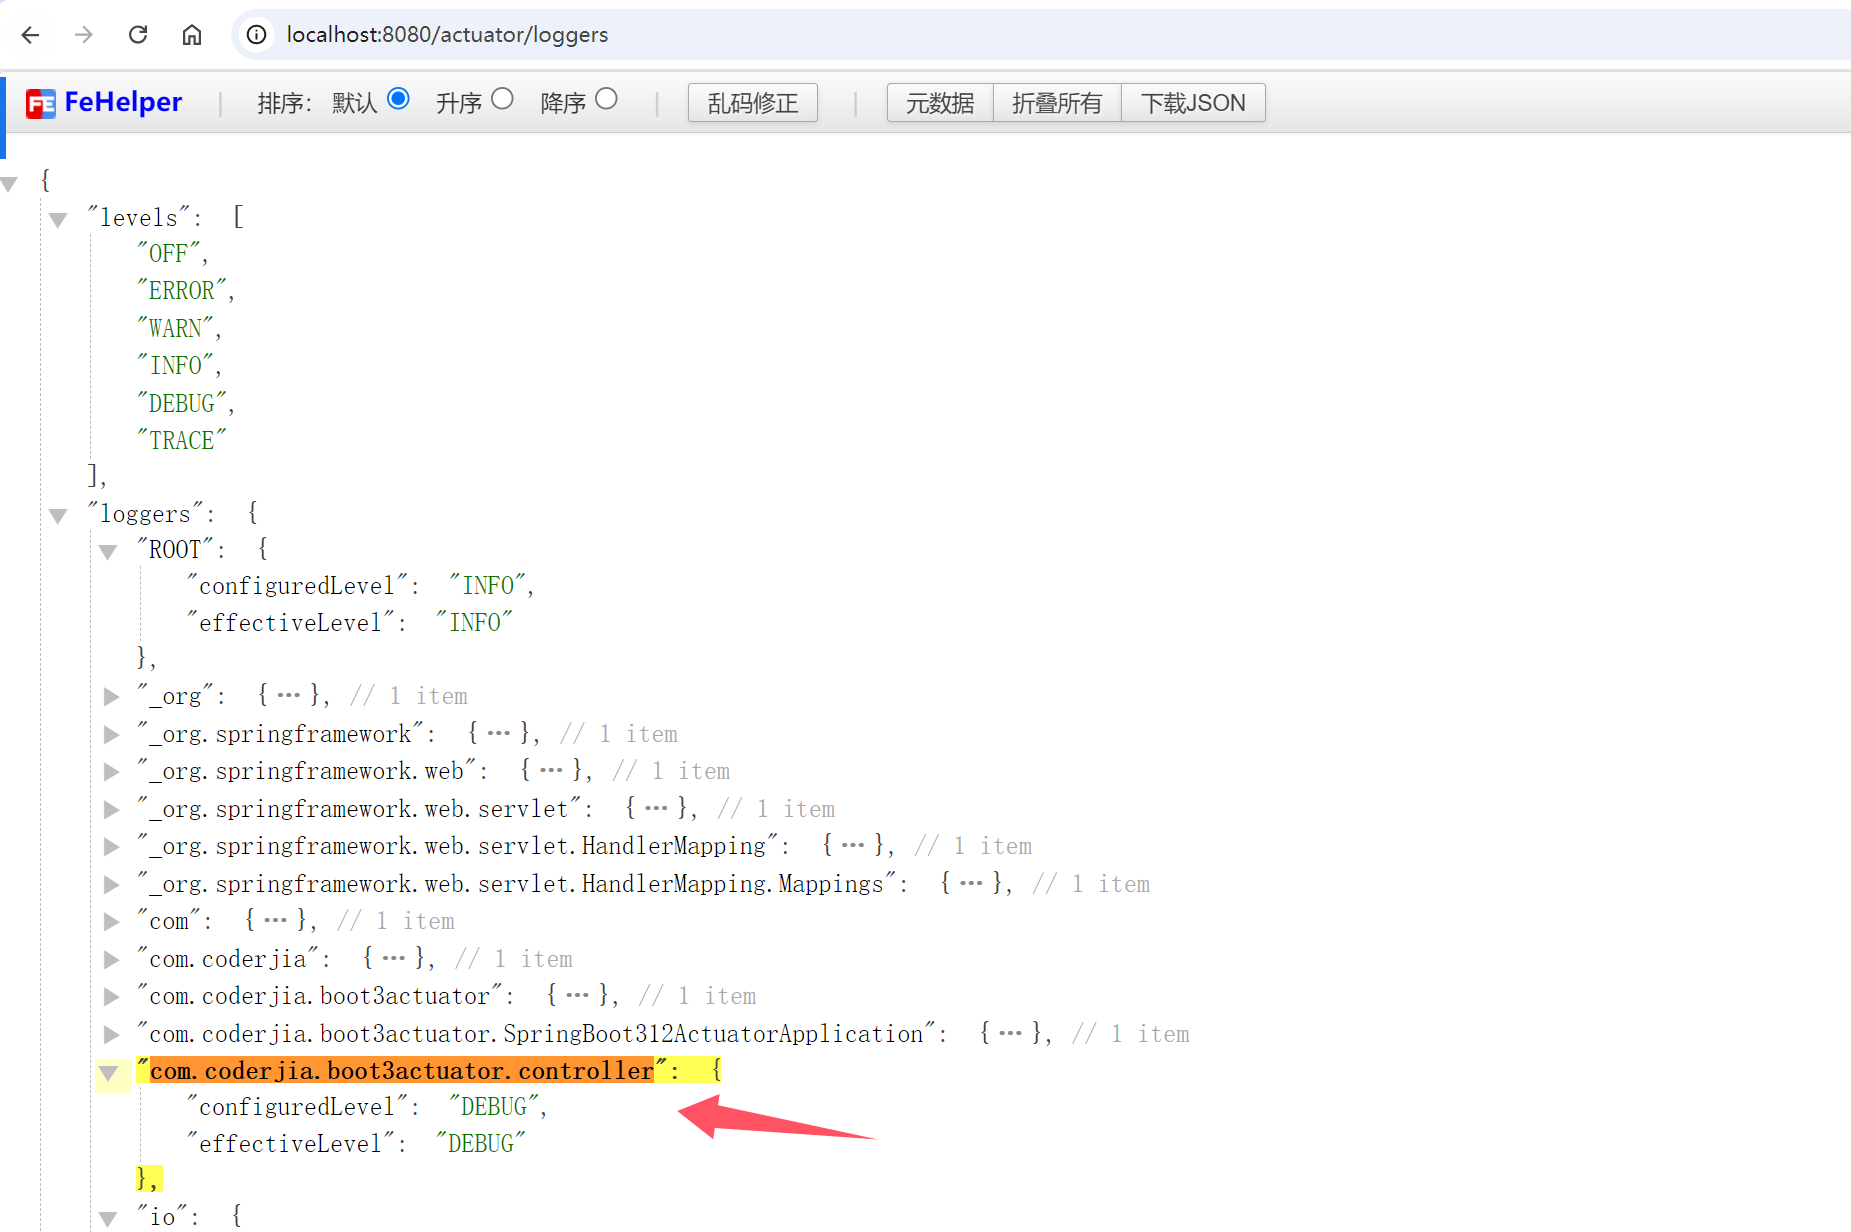
/actuator/loggers 端点允许我们查看和动态调整应用程序的日志级别。访问 /actuator/loggers 将显示应用程序中所有的日志记录器及其当前日志级别。
可以通过发送 HTTP POST 请求来动态更改日志级别:
curl -X POST -d '{"configuredLevel": "DEBUG"}' http://localhost:8080/actuator/loggers/com.coderjia.boot3actuator.controller
此请求将 com.coderjia.boot3actuator.controller 这个包的日志级别设置为 DEBUG。
4. 安全配置
默认情况下,Actuator 端点只在本地开发时可用,生产环境通常需要添加安全机制。可以通过 Spring Security 为 Actuator 端点添加认证和授权。
首先,在 pom.xml 中添加 Spring Security 依赖:
<dependency>
    <groupId>org.springframework.boot</groupId>
    <artifactId>spring-boot-starter-security</artifactId>
</dependency>
接着,在 application.yml 中配置安全设置:
spring:
  # 配置登录springboot admin管理端的账号密码
  security:
    user:
      name: admin
      password: 123456
      roles: ADMIN
management:
  endpoints:
    web:
      exposure:
        include: '*'  # 指定哪些端点公开
  security:
    enabled: true  # 启用安全性
然后,在 SecurityConfig 中配置基本认证:
package com.coderjia.boot3actuator.config;

import org.springframework.context.annotation.Bean;
import org.springframework.context.annotation.Configuration;
import org.springframework.security.config.Customizer;
import org.springframework.security.config.annotation.web.builders.HttpSecurity;
import org.springframework.security.config.annotation.web.configuration.EnableWebSecurity;
import org.springframework.security.web.SecurityFilterChain;

/**
 * @author CoderJia
 * @create 2024/10/13 上午 10:59
 * @Description
 **/
@Configuration
@EnableWebSecurity
public class SecurityConfig {

    @Bean
    public SecurityFilterChain securityFilterChain(HttpSecurity http) throws Exception {
        http
                .authorizeHttpRequests(auth -> auth
                        .requestMatchers("/actuator/**").hasRole("ADMIN") // 保护所有 Actuator 端点,只允许 ADMIN 角色访问
                        .anyRequest().permitAll() // 其他请求允许访问
                )
                .httpBasic(Customizer.withDefaults());
        return http.build();
    }
}
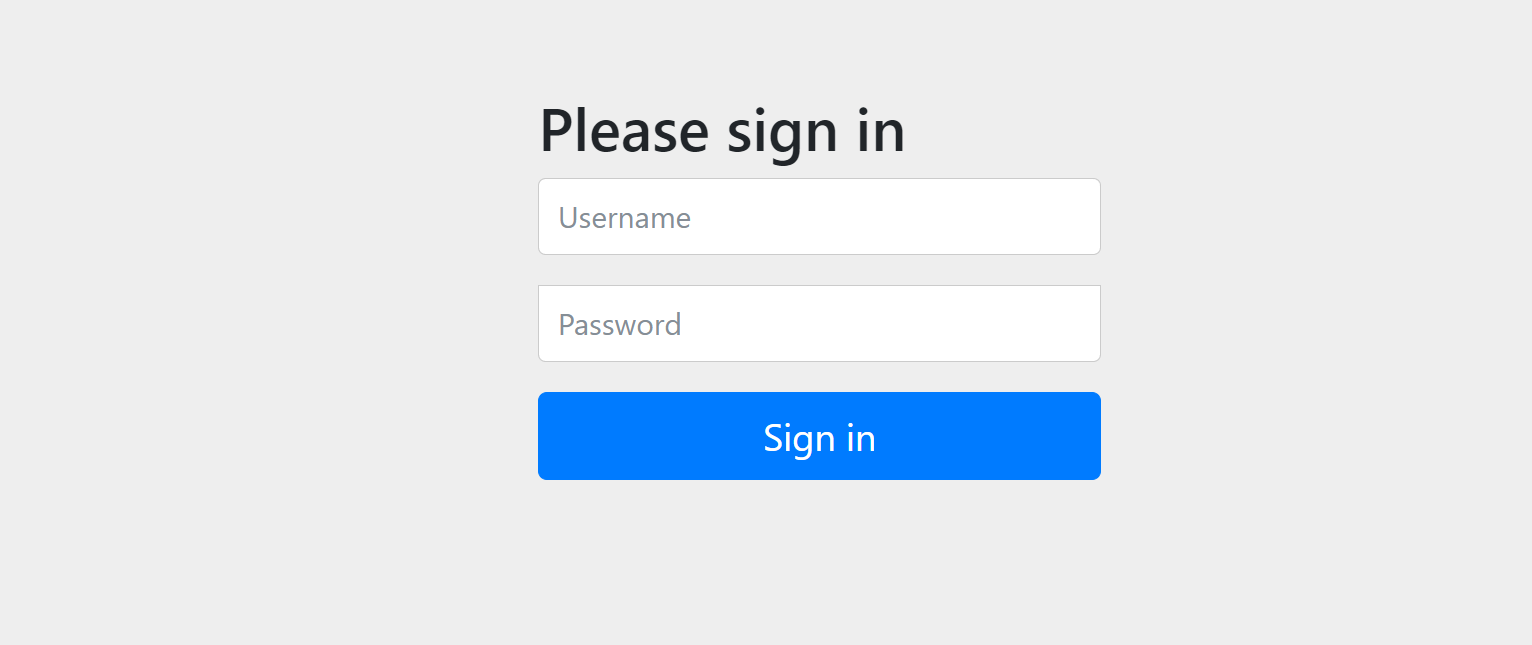
这样,访问 Actuator 端点时将需要提供用户名和密码,使用配置的 admin 和123456 登录即可。
5. 总结
通过 Spring Boot 3 中的 Actuator,我们可以非常方便地监控和管理应用程序的运行时状态。Actuator 提供了丰富的内置端点,帮助我们查看应用的健康状态、运行时指标、日志级别等。同时,Actuator 还允许我们根据需求自定义健康检查和监控端点。结合 Spring Security,我们可以轻松地为 Actuator 端点添加认证和授权,保证生产环境的安全性。
Actuator 是开发人员和运维人员监控 Spring Boot 应用的得力工具,尤其是在复杂的生产环境中,Actuator 能帮助我们快速发现问题并及时处理。