istio实现熔断功能
	熔断的目的是在出现故障或异常情况时,对服务进行自动的限流和隔离,以保护整个系统的稳定性和可用性。
 	上传httpbin镜像和fortio镜像到harbor
 docker tag kong/httpbin:latest 172.16.80.140/istio/httpbin
 docker push 172.16.80.140/istio/httpbin:latest
 docker tag fortio/fortio:latest_release 172.16.80.140/istio/fortio:latest_release
 docker push 172.16.80.140/istio/fortio:latest_release
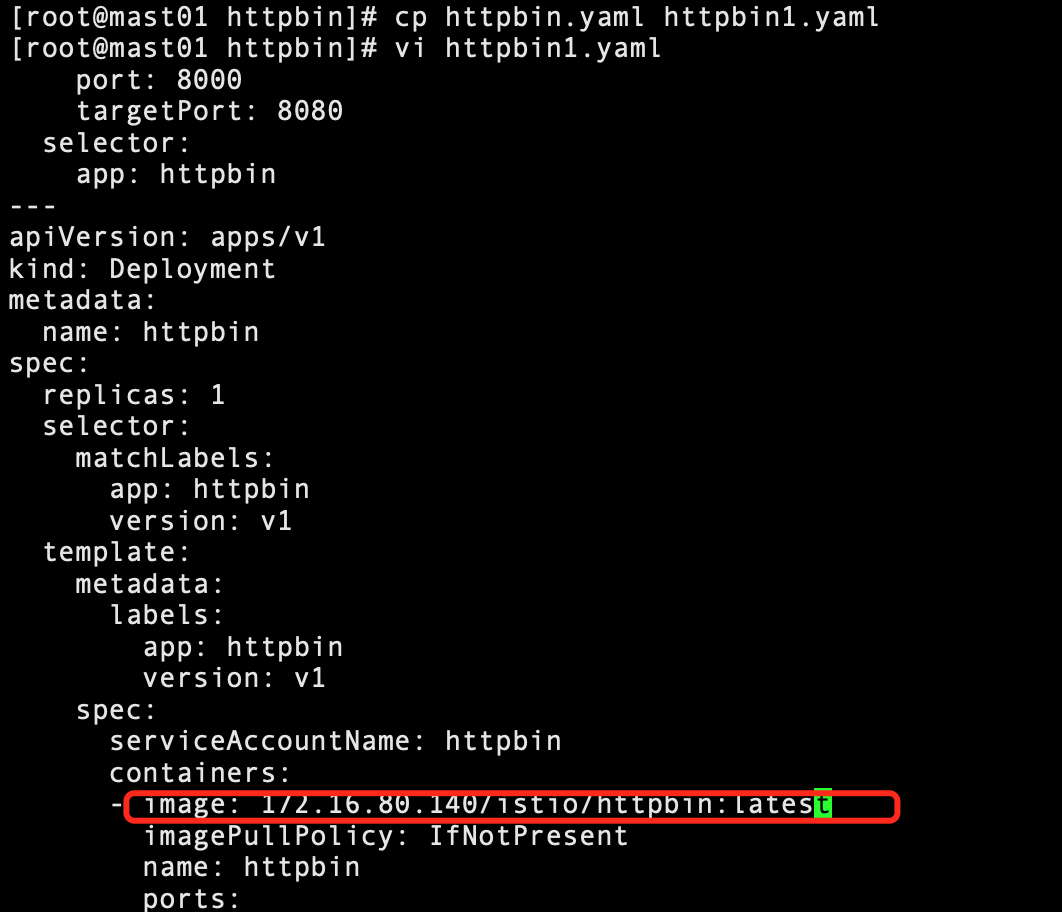
在samples/httpbin下面,修改httpbin.yaml中的镜像为harbor镜像
apiVersion: v1
kind: ServiceAccount
metadata:
  name: httpbin
---
apiVersion: v1
kind: Service
metadata:
  name: httpbin
  labels:
    app: httpbin
    service: httpbin
spec:
  ports:
  - name: http
    port: 8000
    targetPort: 80
  selector:
    app: httpbin
---
apiVersion: apps/v1
kind: Deployment
metadata:
  name: httpbin
spec:
  replicas: 1
  selector:
    matchLabels:
      app: httpbin
      version: v1
  template:
    metadata:
      labels:
        app: httpbin
        version: v1
    spec:
      serviceAccountName: httpbin
      containers:
      - image: 172.16.80.140/istio/httpbin:latest
        imagePullPolicy: IfNotPresent
        name: httpbin
        ports:
        - containerPort: 8080
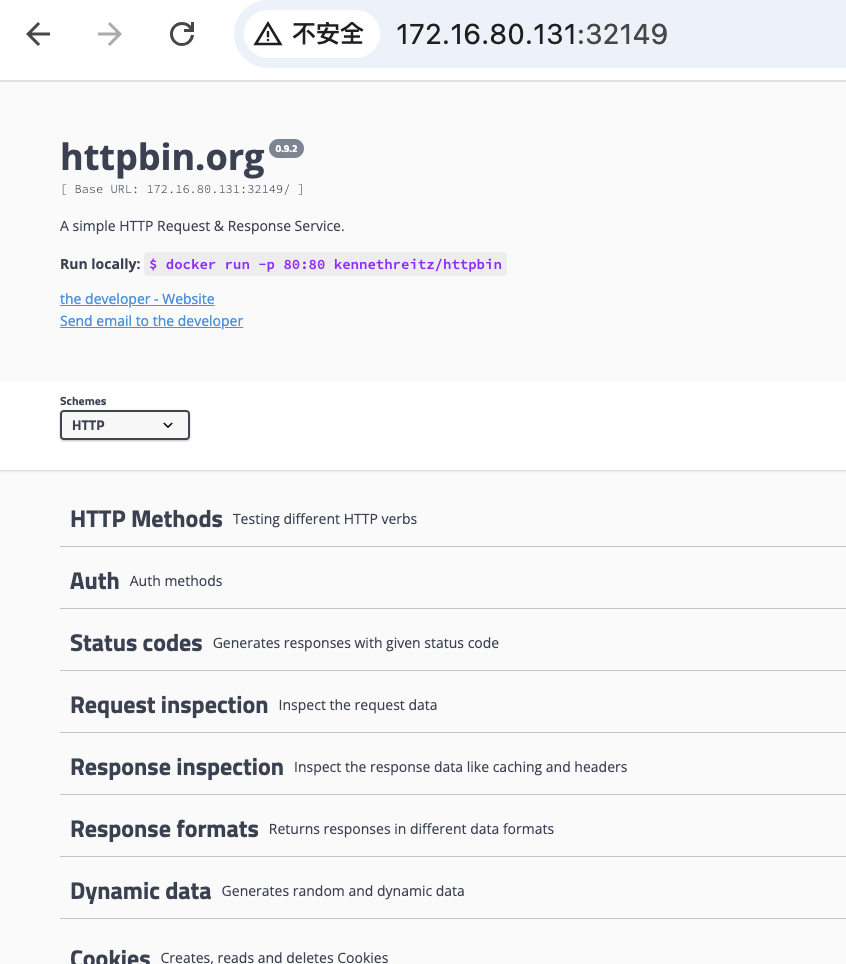
将service httpbin改为nodeport

配置熔断
vim destination-1.yaml
apiVersion:  networking.istio.io/v1beta1
kind: DestinationRule
metadata:
  name: httpbin
spec:
  host: httpbin
  trafficPolicy:
    connectionPool:
      tcp:
        maxConnections: 1
      http:
        http1MaxPendingRequests: 1
        maxRequestsPerConnection: 1
    outlierDetection:
      consecutiveGatewayErrors: 1
      interval: 1s
      baseEjectionTime: 3m
apiVersion: 指定使用的 Istio Networking API 的版本,这里使用的是 networking.istio.io/v1beta1。
kind: 指定资源的类型,这里是 DestinationRule,用于定义目标规则。
metadata: 元数据部分,包含资源的名称和其他附加信息。
name: 资源的名称,这里是 httpbin。
spec: 规则的规范部分,定义了目标规则的详细配置。
host: 指定目标规则应用于的主机,这里是 httpbin。
trafficPolicy: 流量策略部分,用于定义流量控制和故障恢复的策略。
tcp部分配置用于限制TCP连接的数量:
maxConnections: 指定每个目标服务的最大连接数限制为1。这意味着对于每个目标服务,最多只能有1个并发连接。
http部分配置用于限制HTTP连接的数量和请求:
http1MaxPendingRequests: 指定每个连接的最大挂起请求数为1。这表示每个连接最多只能有1个挂起的请求,超过这个数量的请求将被阻塞。
maxRequestsPerConnection: 指定每个连接的最大请求数为1。这意味着每个连接最多只能处理1个请求,处理完请求后连接将被关闭。
outlierDetection部分配置用于检测目标服务的异常情况:
consecutiveGatewayErrors: 指定连续发生网关错误的次数为1。当目标服务连续出现1次网关错误时,将被视为异常情况。
interval: 指定异常检测的时间间隔为1秒。在每个1秒的时间间隔内,将检测目标服务是否出现异常情况。
该配置文件定义了一个名为 httpbin 的目标规则,针对该规则的流量策略包括限制每个目标服务的最大连接数为 1,每个连接的最大挂起请求数为 1,每个连接的最大请求数为 1。此外,该配置还包括异常检测,当连续发生网关错误达到 1 次时,将被视为异常,并且异常检测的时间间隔为 1 秒。
加载fortio的pod做测试,在samples/httpbin/sample-client目录下
 vi fortio-deploy1.yaml
  selector:
    matchLabels:
      app: fortio
  template:
    metadata:
      annotations:
        # This annotation causes Envoy to serve cluster.outbound statistics via 15000/stats
        # in addition to the stats normally served by Istio. The Circuit Breaking example task
        # gives an example of inspecting Envoy stats via proxy config.
        proxy.istio.io/config: |-
          proxyStatsMatcher:
            inclusionPrefixes:
            - "cluster.outbound"
            - "cluster_manager"
            - "listener_manager"
            - "server"
            - "cluster.xds-grpc"
      labels:
        app: fortio
    spec:
      containers:
      - name: fortio
        image: 172.16.80.140/istio/fortio:latest_release
        imagePullPolicy: IfNotPresent
        ports:
        - containerPort: 8080
          name: http-fortio
        - containerPort: 8079
          name: grpc-ping

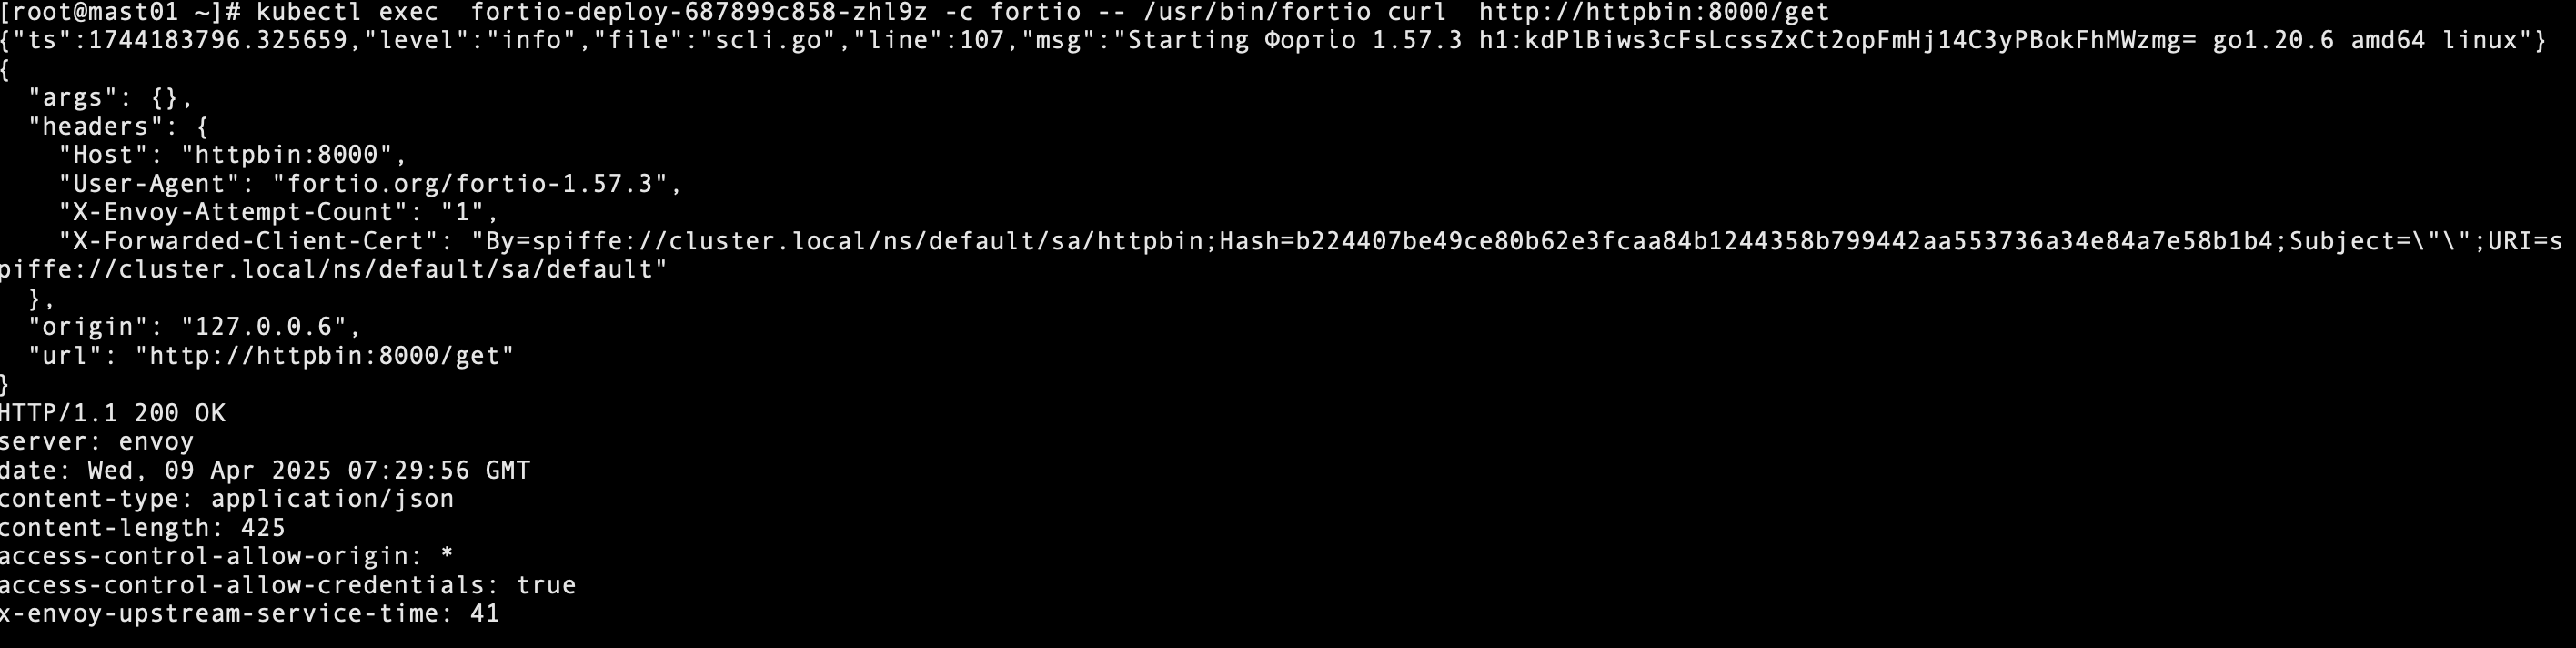
请求测试:
kubectl exec fortio-deploy-687899c858-zhl9z -c fortio -- /usr/bin/fortio curl http://httpbin:8000/get
触发断路器
通过发送20个请求(-n 20)和使用两个并发连接(-c 2)来调用服务。使用了Fortio工具进行测试,命令如下
kubectl exec -it fortio-deploy-687899c858-zhl9z  -c fortio -- /usr/bin/fortio load  -c 2 -qps 0 -n 20 -loglevel Warning http://httpbin:8000/get
[root@mast01 ~]# kubectl exec -it fortio-deploy-687899c858-zhl9z  -c fortio -- /usr/bin/fortio load  -c 2 -qps 0 -n 20 -loglevel Warning http://httpbin:8000/get
07:35:27.869 I logger.go:236> Log level is now 3 Warning (was 2 Info)
Fortio 1.57.3 running at 0 queries per second, 1->1 procs, for 20 calls: http://httpbin:8000/get
Starting at max qps with 2 thread(s) [gomax 1] for exactly 20 calls (10 per thread + 0)
07:35:27.890 W http_client.go:1104> Non ok http code, code="503", status="HTTP/1.1 503", thread="1", run="0"
07:35:27.915 W http_client.go:1104> Non ok http code, code="503", status="HTTP/1.1 503", thread="0", run="0"
07:35:27.928 W http_client.go:1104> Non ok http code, code="503", status="HTTP/1.1 503", thread="0", run="0"
07:35:27.935 W http_client.go:1104> Non ok http code, code="503", status="HTTP/1.1 503", thread="1", run="0"
07:35:27.943 W http_client.go:1104> Non ok http code, code="503", status="HTTP/1.1 503", thread="1", run="0"
07:35:27.958 W http_client.go:1104> Non ok http code, code="503", status="HTTP/1.1 503", thread="0", run="0"
07:35:27.975 W http_client.go:1104> Non ok http code, code="503", status="HTTP/1.1 503", thread="0", run="0"
07:35:27.986 W http_client.go:1104> Non ok http code, code="503", status="HTTP/1.1 503", thread="1", run="0"
Ended after 118.316901ms : 20 calls. qps=169.04
Aggregated Function Time : count 20 avg 0.011317716 +/- 0.00944 min 0.000328661 max 0.037924709 sum 0.226354316
# range, mid point, percentile, count
>= 0.000328661 <= 0.001 , 0.000664331 , 20.00, 4
> 0.002 <= 0.003 , 0.0025 , 25.00, 1
> 0.003 <= 0.004 , 0.0035 , 30.00, 1
> 0.007 <= 0.008 , 0.0075 , 35.00, 1
> 0.008 <= 0.009 , 0.0085 , 45.00, 2
> 0.01 <= 0.011 , 0.0105 , 50.00, 1
> 0.012 <= 0.014 , 0.013 , 70.00, 4
> 0.014 <= 0.016 , 0.015 , 75.00, 1
> 0.016 <= 0.018 , 0.017 , 90.00, 3
> 0.025 <= 0.03 , 0.0275 , 95.00, 1
> 0.035 <= 0.0379247 , 0.0364624 , 100.00, 1
# target 50% 0.011
# target 75% 0.016
# target 90% 0.018
# target 99% 0.0373398
# target 99.9% 0.0378662
Error cases : count 8 avg 0.0042289484 +/- 0.005656 min 0.000328661 max 0.01768967 sum 0.033831587
# range, mid point, percentile, count
>= 0.000328661 <= 0.001 , 0.000664331 , 50.00, 4
> 0.002 <= 0.003 , 0.0025 , 62.50, 1
> 0.003 <= 0.004 , 0.0035 , 75.00, 1
> 0.008 <= 0.009 , 0.0085 , 87.50, 1
> 0.016 <= 0.0176897 , 0.0168448 , 100.00, 1
# target 50% 0.001
# target 75% 0.004
# target 90% 0.0163379
# target 99% 0.0175545
# target 99.9% 0.0176762
# Socket and IP used for each connection:
[0]   5 socket used, resolved to 10.105.2.94:8000, connection timing : count 5 avg 0.0001525874 +/- 4.746e-05 min 7.5829e-05 max 0.000222992 sum 0.000762937
[1]   4 socket used, resolved to 10.105.2.94:8000, connection timing : count 4 avg 0.00076463 +/- 0.001184 min 7.5513e-05 max 0.00281596 sum 0.00305852
Connection time (s) : count 9 avg 0.00042460633 +/- 0.0008468 min 7.5513e-05 max 0.00281596 sum 0.003821457
Sockets used: 9 (for perfect keepalive, would be 2)
Uniform: false, Jitter: false, Catchup allowed: true
IP addresses distribution:
10.105.2.94:8000: 9
Code 200 : 12 (60.0 %)
Code 503 : 8 (40.0 %)
Response Header Sizes : count 20 avg 138.3 +/- 112.9 min 0 max 231 sum 2766
Response Body/Total Sizes : count 20 avg 489.7 +/- 203.1 min 241 max 656 sum 9794
All done 20 calls (plus 0 warmup) 11.318 ms avg, 169.0 qps
从结果可以看出,只有60%的请求成功(Code 200),其余的请求都返回了503错误(Service Unavailable)。每个连接只能处理1个请求,并且最大连接数限制为1。因此,在并发数为2的情况下,第一个并发请求可以成功发送并得到响应,而第二个并发请求会被阻塞,因为只有一个连接可用。随着并发请求的增加,大部分请求都无法成功发送,导致返回了 HTTP 状态码 503。