大家好,我是java1234_小锋老师,最近写了一套【NLP舆情分析】基于python微博舆情分析可视化系统(flask+pandas+echarts)视频教程,持续更新中,计划月底更新完,感谢支持。今天讲解主页-评论用户时间占比环形饼状图实现
视频在线地址:
2026版【NLP舆情分析】基于python微博舆情分析可视化系统(flask+pandas+echarts+爬虫) 视频教程 (火爆连载更新中..)_哔哩哔哩_bilibili
课程简介:
本课程采用主流的Python技术栈实现,Mysql8数据库,Flask后端,Pandas数据分析,前端可视化图表采用echarts,以及requests库,snowNLP进行情感分析,词频统计,包括大量的数据统计及分析技巧。
实现了,用户登录,注册,爬取微博帖子和评论信息,进行了热词统计以及舆情分析,以及基于echarts实现了数据可视化,包括微博文章分析,微博IP分析,微博评论分析,微博舆情分析。最后也基于wordcloud库实现了词云图,包括微博内容词云图,微博评论词云图,微博评论用户词云图等功能。
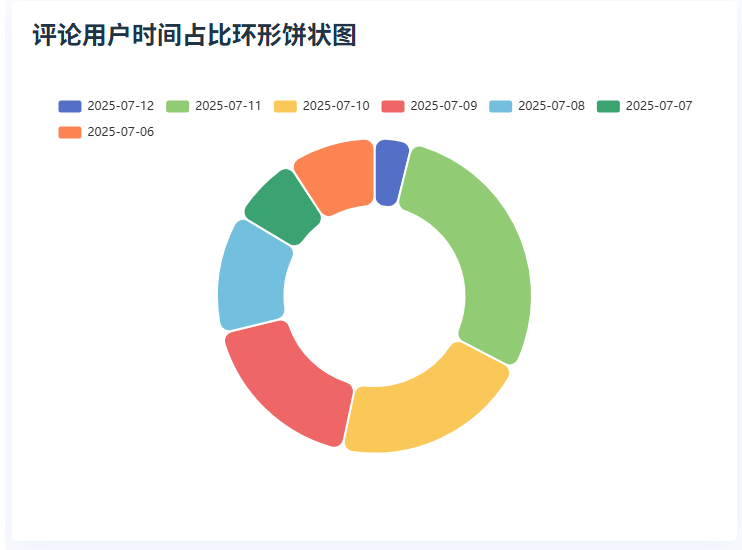
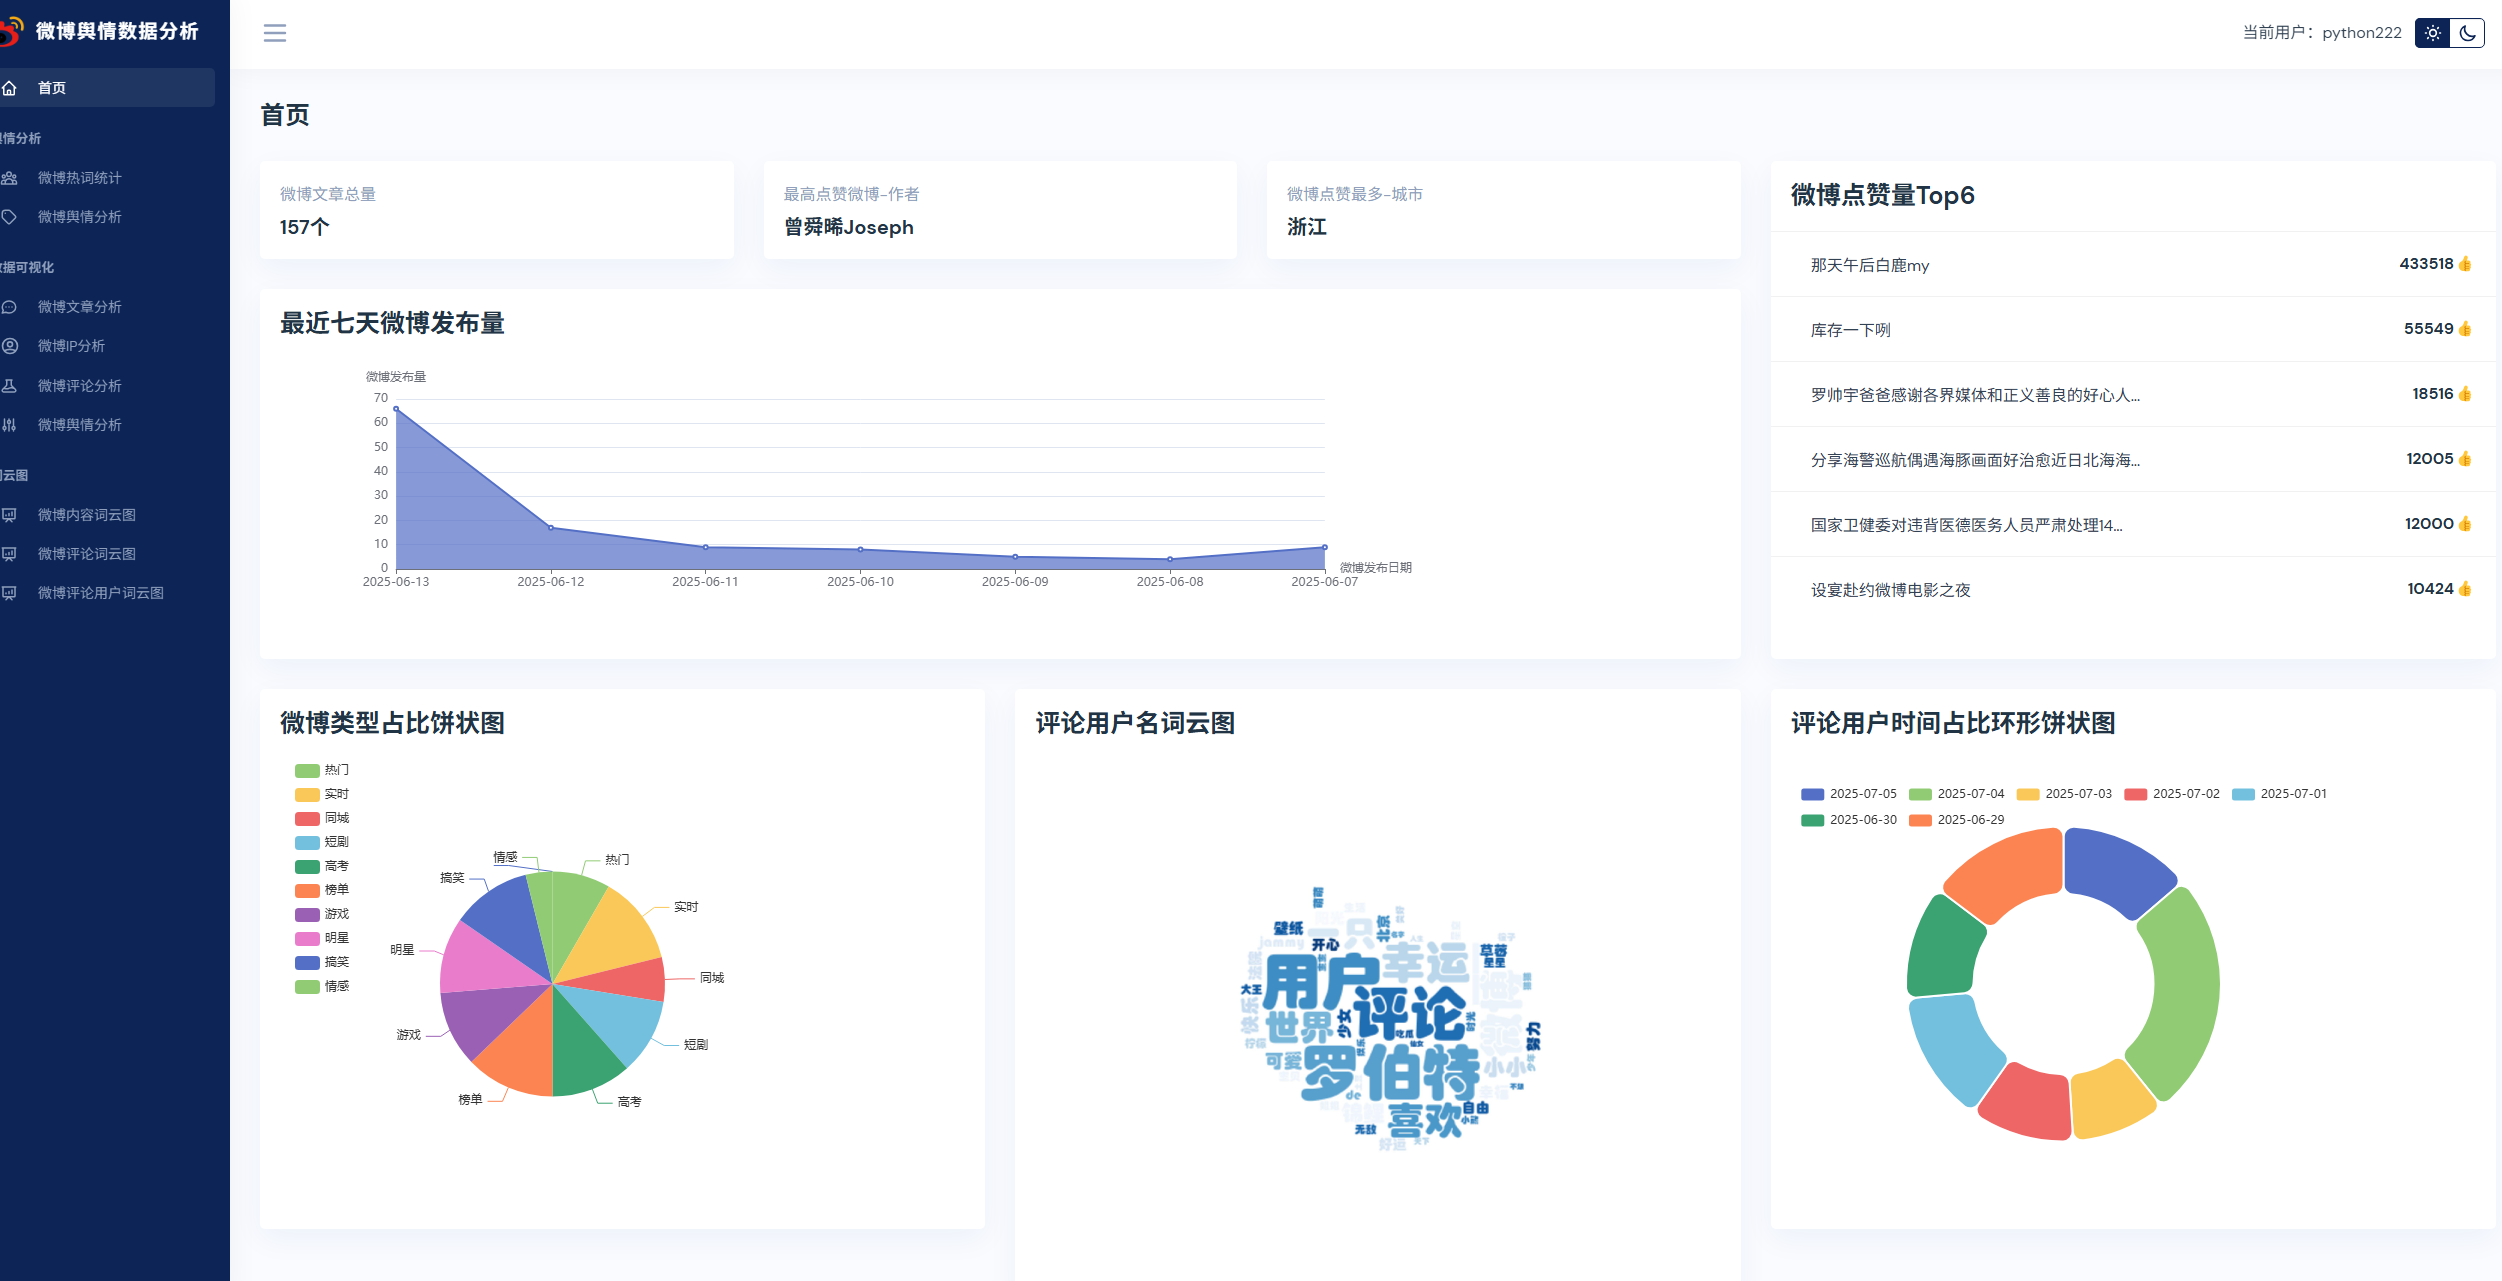
主页-评论用户时间占比环形饼状图实现
首先commentDao实现获取7天用户评论量
def getCommentAmount():
    """
    获取7天用户评论量
    :return:
    """
    con = None
    try:
        con = dbUtil.getCon()
        cursor = con.cursor()
        sql = "select DATE_FORMAT(created_at, '%Y-%m-%d') as commentDate,count(text_raw) as commentTotal from t_comment group by DATE_FORMAT(created_at, '%Y-%m-%d')  order by commentDate desc limit 0,7"
        cursor.execute(sql)
        return cursor.fetchall()
    except Exception as e:
        print(e)
        con.rollback()
        return None
    finally:
        dbUtil.closeCon(con)
page.py的home()方法里,调用commentDao获取数据,然后转发到主页面
# 获取评论数量(最近7天)
commentData = []
commentAmountList = commentDao.getCommentAmount()
for comment in commentAmountList:
commentData.append({'value': comment[1], 'name': comment[0]})
return render_template('index.html',
xAxis7ArticleData=xAxis7ArticleData,
yAxis7ArticleData=yAxis7ArticleData,
arcTypeData=arcTypeData,
commentData=commentData)index.html里 定义图表对象,用得是饼状图,设置数据对象。
var chartDom = document.getElementById('commentUserZb');
var myChart = echarts.init(chartDom);
var option;
option = {
tooltip: {
trigger: 'item'
},
legend: {
top: '5%',
left: 'center'
},
series: [
{
name: '评论用户时间占比',
type: 'pie',
radius: ['40%', '70%'],
avoidLabelOverlap: false,
itemStyle: {
borderRadius: 10,
borderColor: '#fff',
borderWidth: 2
},
label: {
show: false,
position: 'center'
},
emphasis: {
label: {
show: true,
fontSize: 40,
fontWeight: 'bold'
}
},
labelLine: {
show: false
},
data: {{ commentData | tojson }}
}
]
};
option && myChart.setOption(option);运行系统: