在地理信息系统中,矢量数据(点、线、面)是表达地理要素的基础。本章将详细介绍如何在 Cesium 中创建、样式化和管理矢量数据,包括点标记、线要素和面要素的可视化方法,并并提供可直接运行的 Vue2 组件示例。
3.1 矢量数据基础概念
矢量数据通过几何图形描述地理要素,主要包括三种类型:
- 点要素:表示离散的地理位置(如 POI、传感器位置)
- 线要素:表示线性特征(如道路、河流、航线)
- 面要素:表示区域特征(如行政区、湖泊、建筑轮廓)
Cesium 中处理矢量数据的核心类是 Entity(实体),它可以关联几何形状、样式、描述信息等,是组织矢量数据的最佳实践。
3.2 创建点要素(Point)
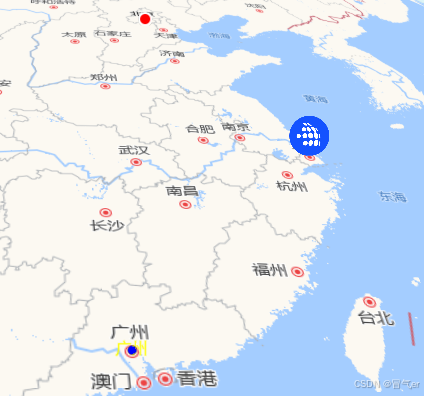
点要素通常用于标记特定位置,Cesium 支持普通点、billboard(广告牌)和标签等多种点展示形式。
3.2.1 基础点要素示例


<!-- 点 -->
<template>
  <div class="cesium-container">
    <div id="cesiumContainer" class="cesium-viewer"></div>
    <div class="control-panel">
      <button @click="addPoints">添加点要素</button>
      <button @click="clearAll">清除所有要素</button>
    </div>
  </div>
</template>

<script>
// 导入地图初始化函数
import initMap from '@/config/initMap.js';
// 导入地图配置项(包含高德地图服务地址等)
import { mapConfig } from '@/config/mapConfig';
// 图片
import iconMaker from '@/assets/images/edit-point.png';

export default {
  name: 'CesiumPoints',
  data() {
    return {
      viewer: null,
      entities: [], // 存储创建的实体,便于后续管理
    };
  },
  mounted() {
    // 初始化Cesium地图,使用高德地图服务
    const options = {
      infoBox: true, // 显示信息框
    };

    this.viewer = initMap(mapConfig.gaode.url3, true, options);
  },
  methods: {
    addPoints() {
      // 清除已有点(避免重复添加)
      this.clearAll();

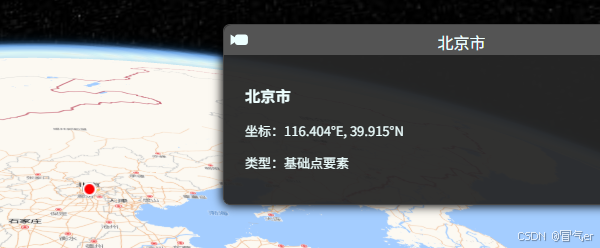
      // 1. 基础点要素(圆形点)
      const beijingPoint = this.viewer.entities.add({
        name: '北京市', // 要素名称(会显示在信息框中)
        position: Cesium.Cartesian3.fromDegrees(116.404, 39.915), // 经纬度
        point: {
          pixelSize: 10, // 像素大小
          color: Cesium.Color.RED, // 颜色
          outlineColor: Cesium.Color.WHITE, // 轮廓颜色
          outlineWidth: 2, // 轮廓宽度
          heightReference: Cesium.HeightReference.CLAMP_TO_GROUND, // 贴地 此属性必须开启3D属性
        },
        // 信息框内容(点击要素时显示)
        description: `
          <div style="padding: 10px;">
            <h3>北京市</h3>
            <p>坐标:116.404°E, 39.915°N</p>
            <p>类型:基础点要素</p>
          </div>
        `,
      });

      // 2. 图片标记点(Billboard)
      const shanghaiPoint = this.viewer.entities.add({
        name: '上海市',
        position: Cesium.Cartesian3.fromDegrees(121.4737, 31.2304),
        billboard: {
          image: iconMaker, // 图片URL
          width: 40, // 宽度
          height: 40, // 高度
          scale: 1.0, // 缩放比例
          // 偏移量(使图片底部中心点对准坐标)
          verticalOrigin: Cesium.VerticalOrigin.BOTTOM,
          horizontalOrigin: Cesium.HorizontalOrigin.CENTER,
        },
        description: `<div><h3>上海市</h3><p>图片标记点示例</p></div>`,
      });

      // 3. 带标签的点
      const guangzhouPoint = this.viewer.entities.add({
        name: '广州市',
        position: Cesium.Cartesian3.fromDegrees(113.2644, 23.1291),
        point: {
          pixelSize: 8,
          color: Cesium.Color.BLUE,
        },
        label: {
          text: '广州', // 标签文本
          font: '16px 微软雅黑', // 字体样式
          fillColor: Cesium.Color.YELLOW, // 文本颜色
          outlineColor: Cesium.Color.BLACK, // 轮廓颜色
          outlineWidth: 2,
          // 标签位置(点的上方)
          verticalOrigin: Cesium.VerticalOrigin.TOP,
          pixelOffset: new Cesium.Cartesian2(0, -10), // 像素偏移
        },
      });

      // 存储实体引用
      this.entities.push(beijingPoint, shanghaiPoint, guangzhouPoint);

      // 定位到所有点的范围
      this.viewer.flyTo(this.entities, {
        duration: 3,
      });
    },
    clearAll() {
      // 移除所有实体
      this.entities.forEach((entity) => {
        this.viewer.entities.remove(entity);
      });
      this.entities = [];
    },
  },
  beforeDestroy() {
    if (this.viewer) {
      this.viewer.destroy();
    }
  },
};
</script>

<style scoped>
.cesium-container {
  width: 100vw;
  height: 100vh;
  position: relative;
}

.cesium-viewer {
  width: 100%;
  height: 100%;
}

.control-panel {
  position: absolute;
  top: 20px;
  left: 20px;
  display: flex;
  gap: 10px;
  z-index: 10;
}

button {
  padding: 8px 12px;
  background: #42b983;
  color: white;
  border: none;
  border-radius: 4px;
  cursor: pointer;
  transition: background 0.3s;
}

button:hover {
  background: #359e75;
}
</style>
3.2.2 关键参数解析
点样式(point):
pixelSize:点的大小(像素)color:点的填充色(支持 RGBA、命名颜色)outlineWidth/outlineColor:点的轮廓样式heightReference:高度参考模式(CLAMP_TO_GROUND贴地,RELATIVE_TO_GROUND相对地面,ABSOLUTE绝对高度)
图片标记(billboard):
image:支持 URL、DataURL 或 CanvasverticalOrigin/horizontalOrigin:锚点位置(控制图片与坐标点的对齐方式)scale:缩放比例(负值会翻转图片)
标签(label):
text:显示文本(支持 HTML 片段)font:字体样式(如"bold 14px sans-serif")pixelOffset:相对于点的像素偏移量
3.3 创建线要素(Polyline)
线要素用于表示路径、边界等线性特征,Cesium 支持多种线样式和动态效果。
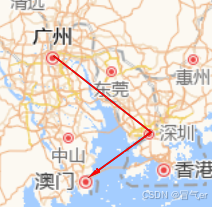
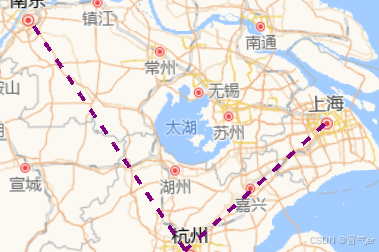
3.3.1 线要素示例(基础线,虚线,箭头线,动态线)


<!-- 线 -->
<template>
  <div class="cesium-container">
    <div id="cesiumContainer" class="cesium-viewer"></div>
    <div class="control-panel">
      <button @click="addPolylines">添加线要素</button>
      <button @click="clearAll">清除所有要素</button>
    </div>
  </div>
</template>

<script>
// 导入地图初始化函数
import initMap from '@/config/initMap.js';
// 导入地图配置项(包含高德地图服务地址等)
import { mapConfig } from '@/config/mapConfig';

export default {
  name: 'CesiumPoints',
  data() {
    return {
      viewer: null,
      entities: [], // 存储创建的实体,便于后续管理
    };
  },
  mounted() {
    // 初始化Cesium地图,使用高德地图服务
    this.viewer = initMap(mapConfig.gaode.url3, true);
  },
  methods: {
    addPolylines() {
      this.clearAll();

      // 1. 基础线要素
      const basicLine = this.viewer.entities.add({
        name: '基础线路',
        polyline: {
          // 线路经纬度点数组
          positions: Cesium.Cartesian3.fromDegreesArray([
            116.404,
            39.915, // 北京
            117.2,
            39.13, // 天津
            118.05,
            39.31, // 唐山
          ]),
          width: 5, // 线宽
          material: Cesium.Color.GREEN, // 线颜色
          clampToGround: true, // 贴地(考虑地形起伏)
        },
      });

      // 2. 虚线样式
      const dashedLine = this.viewer.entities.add({
        name: '虚线线路',
        polyline: {
          positions: Cesium.Cartesian3.fromDegreesArray([
            121.4737,
            31.2304, // 上海
            120.1551,
            30.2741, // 杭州
            118.7969,
            32.0603, // 南京
          ]),
          width: 4,
          material: new Cesium.PolylineDashMaterialProperty({
            color: Cesium.Color.PURPLE,
            dashLength: 20, // 虚线长度
          }),
          clampToGround: true,
        },
      });

      // 3. 带箭头的线
      const arrowLine = this.viewer.entities.add({
        name: '带箭头的线',
        polyline: {
          positions: Cesium.Cartesian3.fromDegreesArray([
            113.2644,
            23.1291, // 广州
            114.0665,
            22.5488, // 深圳
            113.5494,
            22.1987, // 珠海
          ]),
          width: 6,
          material: new Cesium.PolylineArrowMaterialProperty(Cesium.Color.RED),
          clampToGround: true,
        },
      });


      this.entities.push(basicLine, dashedLine, arrowLine);
      this.viewer.flyTo(this.entities, { duration: 3 });
    },
    clearAll() {
      // 移除所有实体
      this.entities.forEach((entity) => {
        this.viewer.entities.remove(entity);
      });
      this.entities = [];
    },
  },
  beforeDestroy() {
    if (this.viewer) {
      this.viewer.destroy();
    }
  },
};
</script>

<style scoped>
.cesium-container {
  width: 100vw;
  height: 100vh;
  position: relative;
}

.cesium-viewer {
  width: 100%;
  height: 100%;
}

.control-panel {
  position: absolute;
  top: 20px;
  left: 20px;
  display: flex;
  gap: 10px;
  z-index: 10;
}

button {
  padding: 8px 12px;
  background: #42b983;
  color: white;
  border: none;
  border-radius: 4px;
  cursor: pointer;
  transition: background 0.3s;
}

button:hover {
  background: #359e75;
}
</style>
3.3.2 线要素关键技术
坐标定义:
fromDegreesArray([lon1, lat1, lon2, lat2, ...]):适用于 2D 贴地线fromDegreesArrayHeights([lon1, lat1, h1, lon2, lat2, h2, ...]):支持高度参数
材质(material):
- 基础颜色:
Cesium.Color.XXX - 虚线:
PolylineDashMaterialProperty(可配置虚线长度、间隔) - 箭头:
PolylineArrowMaterialProperty(自动在终点显示箭头) - 发光效果:
PolylineGlowMaterialProperty(适合动态效果)
- 基础颜色:
地形贴合:
clampToGround: true:线会贴合地形起伏(适合道路、河流)clampToGround: false:线会保持直线(适合航线、管道)
3.4 创建面要素(Polygon)
面要素用于表示区域,如行政区、湖泊等,支持填充色、轮廓线等样式配置。
3.4.1 面要素示例
<!-- 面 -->
<!-- 线 -->
<template>
  <div class="cesium-container">
    <div id="cesiumContainer" class="cesium-viewer"></div>
    <div class="control-panel">
      <button @click="addPolygons">添加面要素</button>
      <button @click="clearAll">清除所有要素</button>
    </div>
  </div>
</template>

<script>
// 导入地图初始化函数
import initMap from '@/config/initMap.js';
// 导入地图配置项(包含高德地图服务地址等)
import { mapConfig } from '@/config/mapConfig';

export default {
  name: 'CesiumPoints',
  data() {
    return {
      viewer: null,
      entities: [], // 存储创建的实体,便于后续管理
    };
  },
  mounted() {
    // 初始化Cesium地图,使用高德地图服务
    this.viewer = initMap(mapConfig.gaode.url3, true);
  },
  methods: {
    addPolygons() {
      this.clearAll();

      // 1. 基础多边形
      const basicPolygon = this.viewer.entities.add({
        name: '基础多边形',
        polygon: {
          // 多边形顶点(闭合区域,最后一点可与第一点重合)
          hierarchy: new Cesium.PolygonHierarchy(
            Cesium.Cartesian3.fromDegreesArray([
              116.1, 39.9, 116.5, 39.9, 116.5, 39.5, 116.1, 39.5,
            ])
          ),
          material: Cesium.Color.RED.withAlpha(0.3), // 填充色(带透明度)
          outline: true, // 显示轮廓
          outlineColor: Cesium.Color.RED, // 轮廓颜色
          outlineWidth: 2,
          height: 0, // 高度(0表示贴地)
          extrudedHeight: 50000, // 拉伸高度(为0时不拉伸)
        },
      });

      // 2. 带孔的多边形
      const holePolygon = this.viewer.entities.add({
        name: '带孔多边形',
        polygon: {
          hierarchy: new Cesium.PolygonHierarchy(
            // 外环
            Cesium.Cartesian3.fromDegreesArray([
              121.0, 31.0, 121.8, 31.0, 121.8, 30.5, 121.0, 30.5,
            ]),
            // 内环(孔)
            [
              Cesium.Cartesian3.fromDegreesArray([
                121.2, 30.8, 121.6, 30.8, 121.6, 30.6, 121.2, 30.6,
              ]),
            ]
          ),
          material: new Cesium.ColorMaterialProperty(
            Cesium.Color.BLUE.withAlpha(0.3)
          ),
          outline: true,
          outlineColor: Cesium.Color.BLUE,
        },
      });

      // 3. 动态颜色面
      const dynamicPolygon = this.viewer.entities.add({
        name: '动态面',
        polygon: {
          hierarchy: new Cesium.PolygonHierarchy(
            Cesium.Cartesian3.fromDegreesArray([
              113.0, 22.5, 114.0, 22.5, 114.0, 22.0, 113.0, 22.0,
            ])
          ),
          material: Cesium.Color.GREEN.withAlpha(0.3),
          outline: true,
        },
      });

      // 添加颜色动画
      this.viewer.clock.onTick.addEventListener((clock) => {
        const time = clock.currentTime.secondsOfDay;
        const hue = (time % 10) / 10; // 每10秒循环一次色相
        dynamicPolygon.polygon.material = Cesium.Color.fromHsl(
          hue,
          0.7,
          0.5,
          0.3
        );
      });

      this.entities.push(basicPolygon, holePolygon, dynamicPolygon);
      this.viewer.flyTo(this.entities[2], { duration: 3 });
    },
    clearAll() {
      // 移除所有实体
      this.entities.forEach((entity) => {
        this.viewer.entities.remove(entity);
      });
      this.entities = [];
    },
  },
  beforeDestroy() {
    if (this.viewer) {
      this.viewer.destroy();
    }
  },
};
</script>

<style scoped>
.cesium-container {
  width: 100vw;
  height: 100vh;
  position: relative;
}

.cesium-viewer {
  width: 100%;
  height: 100%;
}

.control-panel {
  position: absolute;
  top: 20px;
  left: 20px;
  display: flex;
  gap: 10px;
  z-index: 10;
}

button {
  padding: 8px 12px;
  background: #42b983;
  color: white;
  border: none;
  border-radius: 4px;
  cursor: pointer;
  transition: background 0.3s;
}

button:hover {
  background: #359e75;
}
</style>
3.4.2 面要素核心参数
层级结构(hierarchy):
- 外环:定义多边形的外边界
- 内环:定义多边形中的 "孔"(支持多个孔)
高度参数:
height:多边形底部高度extrudedHeight:多边形顶部高度(当extrudedHeight > height时形成 3D 立体效果)
样式控制:
material:填充材质(支持颜色、纹理、动态材质)outline:是否显示轮廓线perPositionHeight:是否使用每个顶点的高度(默认使用统一高度)
3.5 实体管理最佳实践
批量操作:
- 使用
viewer.entities.addAll(entitiesArray)批量添加 - 使用
viewer.entities.removeAll()清空所有实体
- 使用
属性查询:
// 根据名称查询实体 const beijing = this.viewer.entities.getById('beijing-point'); // 遍历所有实体 this.viewer.entities.values.forEach(entity => { console.log(entity.name); });性能优化:
- 对于大量点数据(>1000),考虑使用
PointPrimitiveCollection替代Entity - 复杂面要素可简化顶点数量
- 关闭不可见区域的要素渲染
- 对于大量点数据(>1000),考虑使用
小结
本章系统介绍了 Cesium 矢量数据可视化的核心方法:
- 点要素:包括基础点、图片标记和标签的创建与样式设置
- 线要素:掌握普通线、虚线、箭头线和动态线的实现
- 面要素:学习基础多边形、带孔多边形和 3D 拉伸效果的配置
- 实体管理:了解实体的添加、删除、查询和性能优化技巧
这些技能是构建地理信息应用的基础,下一章节内容将学习如何加载和展示 GIS 矢量数据(如 GeoJSON、KML 等格式)。