一、如何将数据保存为excel文档
1.excel文件库与相关使用
(1)导入相应的excel文件库,导入前先要进行pip安装,pip install xlwt
import xlwt # 导入用于创建和写入Excel文件的库(2) 建立一个excel文档,并在第0行写入标题
# 创建一个数据存储的excel文档
# 第一个参数为编码格式,第二个参数表示不压缩文档
data = xlwt.Workbook(encoding='utf-8', style_compression=0)
# 在这个excel文件里面建立一个工作表sheet,表名称为moveData
# cell_overwrite_ok表示单元格可以重新赋值
sheet = data.add_sheet('moveData', cell_overwrite_ok=True)
# 定义列的名称,并将其写入sheet表单
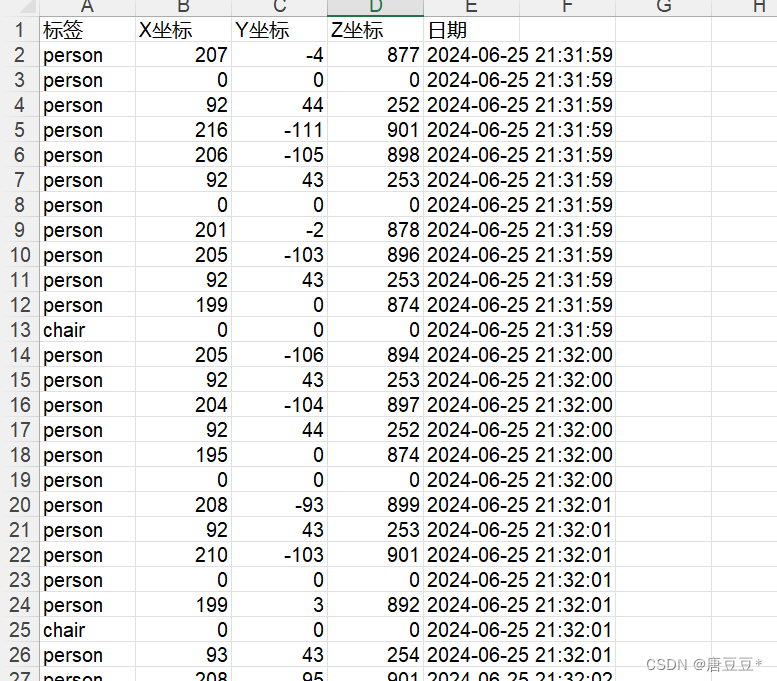
colume = ('标签', 'X坐标', 'Y坐标', 'Z坐标','日期')
for i in range(len(colume)):
sheet.write(0, i, colume[i])2.将三维坐标添加到excel文档中
(1)首先需要对YOLOv8识别结果进行对应的信息获取,得到识别物品名称和相应的三维坐标信息。
(2) 然后需要将相应的信息写入excel文档,写入时首先获取当前工作表有多少行,再在下一行进行写入。写入的第0列是标签,第1-3列是x、y、z坐标,第4列是时间,此处用datetime函数需要导入datetime库文件
# 获取当前工作表的长度信息
row_count = len(sheet.rows)
# 写入识别物体的名称到第row_count行
sheet.write(row_count, 0, name)
# 写入x,y,z坐标
for k in range(len(camera_xyz)):
   sheet.write(row_count, k+1, camera_xyz[k])
# 写入时间
current_time = datetime.now().strftime('%Y-%m-%d %H:%M:%S')
sheet.write(row_count, len(camera_xyz)+1, current_time)
3.将excel文件进行保存
当遇到停止指令,即键盘输入Esc或Q时,则停止并保存数据文件到指定的地址——savepath
key = cv2.waitKey(1)  # 等待用户输入
# Press esc or 'q' to close the image window
if key & 0xFF == ord('q') or key == 27:
    cv2.destroyAllWindows()
    pipeline.stop()
    # 保存实时数据到文件中
    savepath = 'E:\T\data.xls'
    data.save(savepath)
    break
二、全部代码文件展示
# 此程序用于实现视频分帧识别物体,并为所识别的物品添加矩形框,显示置信度、标签等,更新于2024/6/24
# 更新程序,用于显示实时三维坐标2024/6/24
# 2024/6/25 更新了数据保存
import cv2
import numpy as np
import pyrealsense2 as rs
from ultralytics import YOLO # 将YOLOv8导入到该py文件中
import xlwt # 导入用于创建和写入Excel文件的库
from datetime import datetime # 用于查看现在时间的库函数
import time # 用于实现计时器的作用
# 加载官方或自定义模型
model = YOLO(r"E:\Deep learning\YOLOv8\yolov8n.pt") # 加载一个官方的检测模型
# model = YOLO(r"E:\Deep learning\YOLOv8\yolov8s.pt") # 加载一个官方的检测模型
# model = YOLO(r"E:\Deep learning\YOLOv8\yolov8n-seg.pt") # 加载一个官方的分割模型
# model = YOLO(r"E:\Deep learning\YOLOv8\yolov8n-pose.pt") # 加载一个官方的姿态模型
# 深度相机配置
pipeline = rs.pipeline() # 定义流程pipeline,创建一个管道
config = rs.config() # 定义配置config
config.enable_stream(rs.stream.depth, 640, 480, rs.format.z16, 30) # 初始化摄像头深度流
config.enable_stream(rs.stream.color, 640, 480, rs.format.bgr8, 30)
pipe_profile = pipeline.start(config) # 启用管段流
align = rs.align(rs.stream.color) # 这个函数用于将深度图像与彩色图像对齐
# 创建一个数据存储的excel文档
# 第一个参数为编码格式,第二个参数表示不压缩文档
data = xlwt.Workbook(encoding='utf-8', style_compression=0)
# 在这个excel文件里面建立一个工作表sheet,表名称为moveData
# cell_overwrite_ok表示单元格可以重新赋值
sheet = data.add_sheet('moveData', cell_overwrite_ok=True)
# 定义列的名称,并将其写入sheet表单
colume = ('标签', 'X坐标', 'Y坐标', 'Z坐标','日期')
for i in range(len(colume)):
sheet.write(0, i, colume[i])
# 检验是否可以最终退出保存用
# for i in range(len(col)):
# sheet.write(2, i, col[i])
def get_aligned_images(): # 定义一个获取图像帧的函数,返回深度和彩色数组
frames = pipeline.wait_for_frames() # 等待获取图像帧
aligned_frames = align.process(frames) # 获取对齐帧,将深度框与颜色框对齐
depth_frame = aligned_frames.get_depth_frame() # 获取深度帧
color_frame = aligned_frames.get_color_frame() # 获取对齐帧中的的color帧
depth_image = np.asanyarray(depth_frame.get_data()) # 将深度帧转换为NumPy数组
color_image = np.asanyarray(color_frame.get_data()) # 将彩色帧转化为numpy数组
# 获取相机内参
# 获取深度内参
depth_intri = depth_frame.profile.as_video_stream_profile().intrinsics
# 获取彩色内参
color_intri = color_frame.profile.as_video_stream_profile().intrinsics
# 命令行输出内参检查
# print("Depth Intrinsics:",depth_intri)
# print("Color Intrinsics:",color_intri)
# cv2.applyColorMap()将深度图像转化为彩色图像,以便更好的可视化分析
depth_colormap = cv2.applyColorMap(
cv2.convertScaleAbs(depth_image, alpha=0.07), cv2.COLORMAP_JET)
# 返回深度内参、对齐深度帧、彩色图像
return depth_intri, depth_frame, color_image
if __name__ == '__main__':
# 设置计时器
start_time = time.time()
# 间隔时间,单位s
step_time = 0.5
try:
while True:
depth_intri, depth_frame, color_image = get_aligned_images() # 获取深度帧和彩色帧
# 每0.5s做一次预测,并显示结果
if time.time()-start_time >= step_time:
start_time = time.time()
source = [color_image]
# 轨迹追踪,persist=true表示数据储存
# results = model.track(source, persist=True)
results = model.predict(source, save=False)
# 预测完后打印目标框
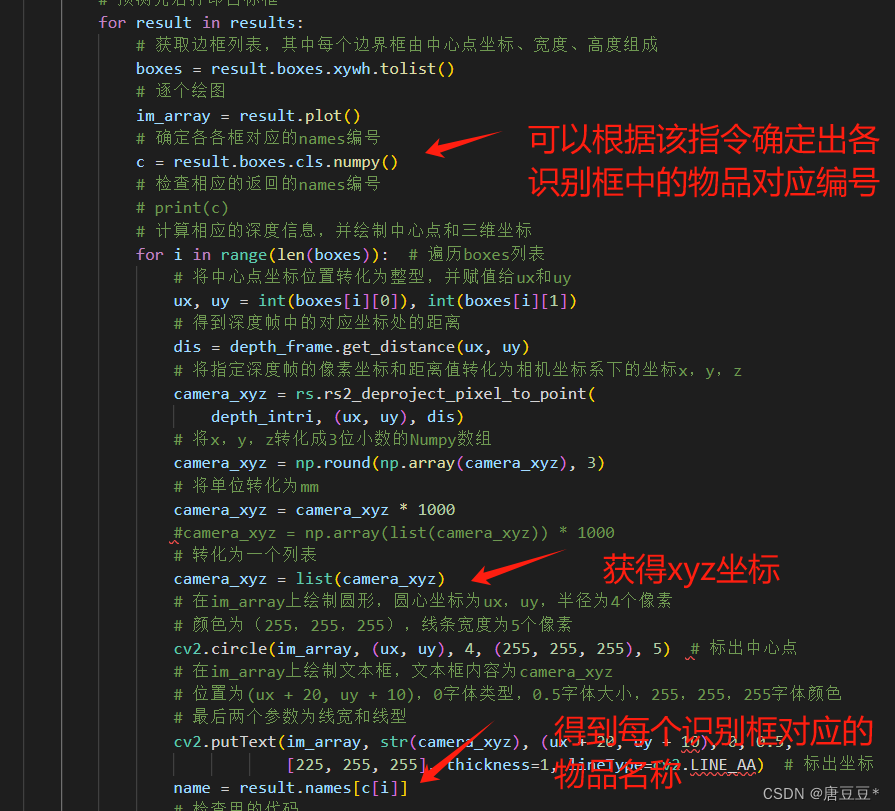
for result in results:
# 获取边框列表,其中每个边界框由中心点坐标、宽度、高度组成
boxes = result.boxes.xywh.tolist()
# 逐个绘图
im_array = result.plot()
# 确定各各框对应的names编号
c = result.boxes.cls.numpy()
# 检查相应的返回的names编号
# print(c)
# 计算相应的深度信息,并绘制中心点和三维坐标
for i in range(len(boxes)): # 遍历boxes列表
# 将中心点坐标位置转化为整型,并赋值给ux和uy
ux, uy = int(boxes[i][0]), int(boxes[i][1])
# 得到深度帧中的对应坐标处的距离
dis = depth_frame.get_distance(ux, uy)
# 将指定深度帧的像素坐标和距离值转化为相机坐标系下的坐标x,y,z
camera_xyz = rs.rs2_deproject_pixel_to_point(
depth_intri, (ux, uy), dis)
# 将x,y,z转化成3位小数的Numpy数组
camera_xyz = np.round(np.array(camera_xyz), 3)
# 将单位转化为mm
camera_xyz = camera_xyz * 1000
#camera_xyz = np.array(list(camera_xyz)) * 1000
# 转化为一个列表
camera_xyz = list(camera_xyz)
# 在im_array上绘制圆形,圆心坐标为ux,uy,半径为4个像素
# 颜色为(255,255,255),线条宽度为5个像素
cv2.circle(im_array, (ux, uy), 4, (255, 255, 255), 5) # 标出中心点
# 在im_array上绘制文本框,文本框内容为camera_xyz
# 位置为(ux + 20, uy + 10),0字体类型,0.5字体大小,255,255,255字体颜色
# 最后两个参数为线宽和线型
cv2.putText(im_array, str(camera_xyz), (ux + 20, uy + 10), 0, 0.5,
[225, 255, 255], thickness=1, lineType=cv2.LINE_AA) # 标出坐标
name = result.names[c[i]]
# 检查用的代码
# print("name:", name)
# Data = [name, np.array(camera_xyz)]
# print("Data:", Data)
# print("x:",camera_xyz[1])
# print("len_Data:", len(Data))
row_count = len(sheet.rows)
# print("row_count:", row_count)
# 写入识别物体的名称
sheet.write(row_count, 0, name)
# 写入x,y,z坐标
for k in range(len(camera_xyz)):
sheet.write(row_count, k+1, camera_xyz[k])
# 写入时间
current_time = datetime.now().strftime('%Y-%m-%d %H:%M:%S')
sheet.write(row_count, len(camera_xyz)+1, current_time)
# 设置窗口,窗口大小根据图像自动调整
cv2.namedWindow('RealSense', cv2.WINDOW_AUTOSIZE)
# 将图像images显示在窗口中,这个显示的是带有追踪结果的图像
cv2.imshow('RealSense', im_array)
cv2.imwrite('E:\T\picture.png', im_array)
key = cv2.waitKey(1) # 等待用户输入
# Press esc or 'q' to close the image window
if key & 0xFF == ord('q') or key == 27:
cv2.destroyAllWindows()
pipeline.stop()
# 保存实时数据到文件中
savepath = 'E:\T\data.xls'
data.save(savepath)
break
finally:
# Stop streaming
pipeline.stop()
三、excel结果显示