环境准备:
| 服务器名称 | 内网IP | 公网IP |
|---|---|---|
| Prometheus服务器 | 192.168.0.230 | 47.119.21.167 |
| Grafana服务器 | 192.168.0.231 | 47.119.22.8 |
| 被监控服务器 | 192.168.0.232 | 47.119.22.82 |
更改主机名方便辨认
hostnamectl set-hostname prometheus
hostnamectl set-hostname grafana
hostnamectl set-hostname agent
三台都互相绑定IP与主机名
vim /etc/hosts
192.168.0.230 prometheus
192.168.0.231 grafana
192.168.0.232 agent时间同步
检查时间:
timedatectl status
修改时区
timedatectl set-timezone Asia/Shanghai关闭防火墙
输入以下命令以禁用防火墙服务:
systemctl stop ufw.service
输入以下命令以确认防火墙服务已关闭:
systemctl disable ufw.service
输入以下命令以确认防火墙状态:
ufw status
如果终端输出“Status: inactive”,则表示防火墙已成功关闭。1、安装Prometheus
从 https://prometheus.io/download/ 下载相应版本,安装到服务器上,官网提供的是二进制版,解压就能用,不需要编译
下载tar包
wget https://github.com/prometheus/prometheus/releases/download/v2.53.0/prometheus-2.53.0.linux-amd64.tar.gz
解压
tar xf prometheus-2.53.0.linux-amd64.tar.gz -C /usr/local/
mv /usr/local/prometheus-2.53.0.linux-amd64/ /usr/local/prometheus
直接使用默认配置文件启动
/usr/local/prometheus/prometheus --config.file="/usr/local/prometheus/prometheus.yml" &
确认端口(9090)
lsof -i:90902、Prometheus界面
通过浏览器访问http://服务器IP:9090就可以访问到prometheus的主界面

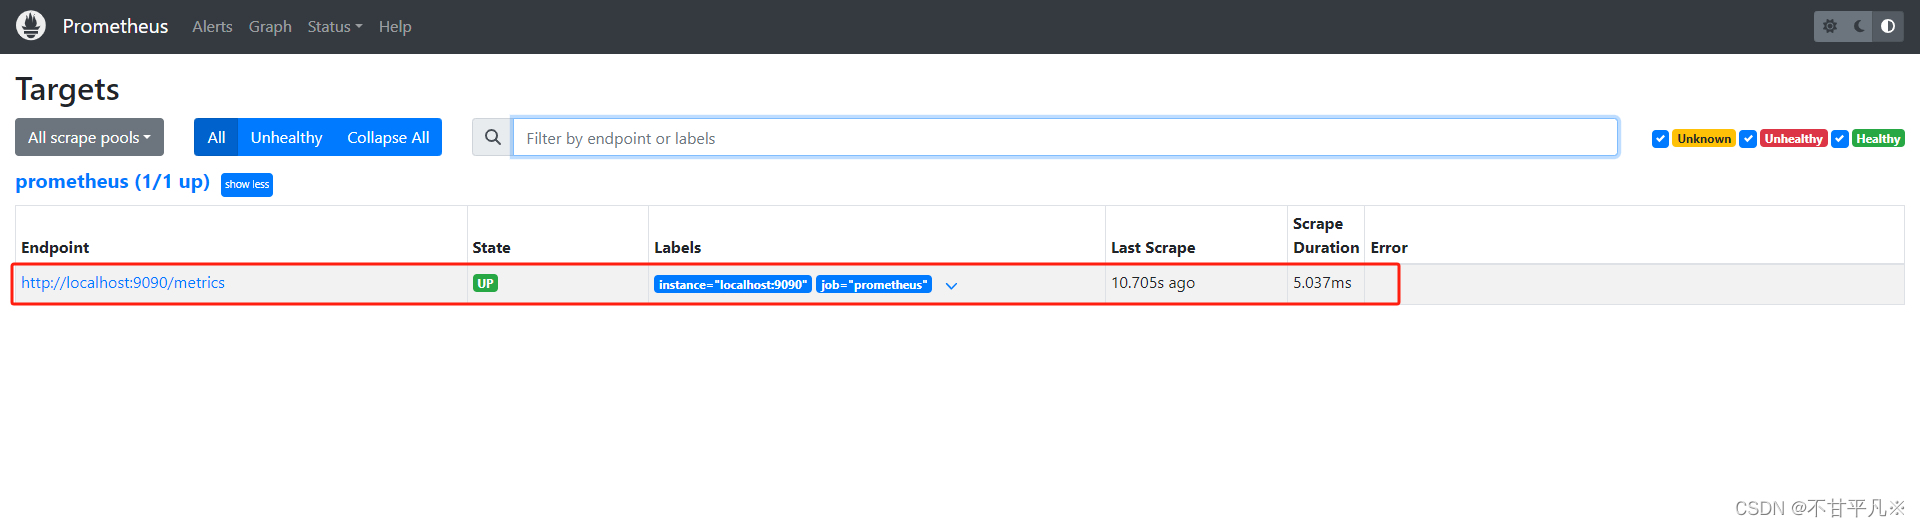
默认只监控了本机一台,点Status --》点Targets --》可以看到只监控了本机
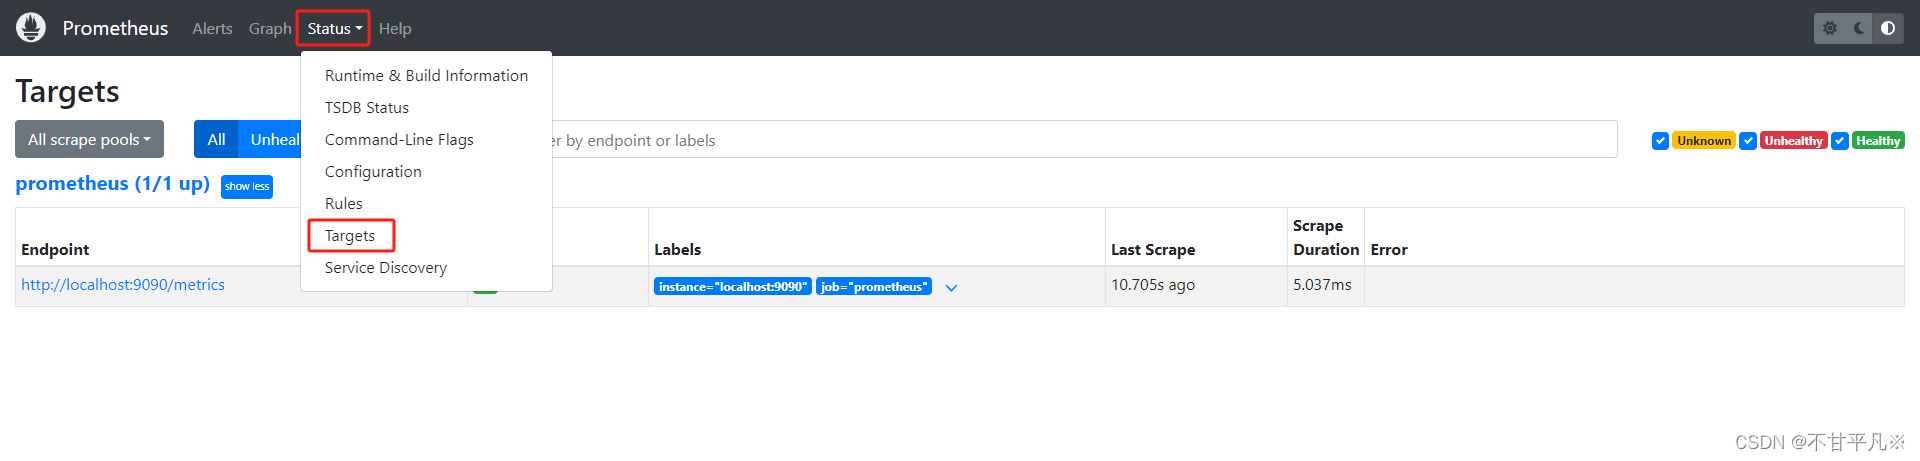
监控的本机信息如下:
3、主机数据展示
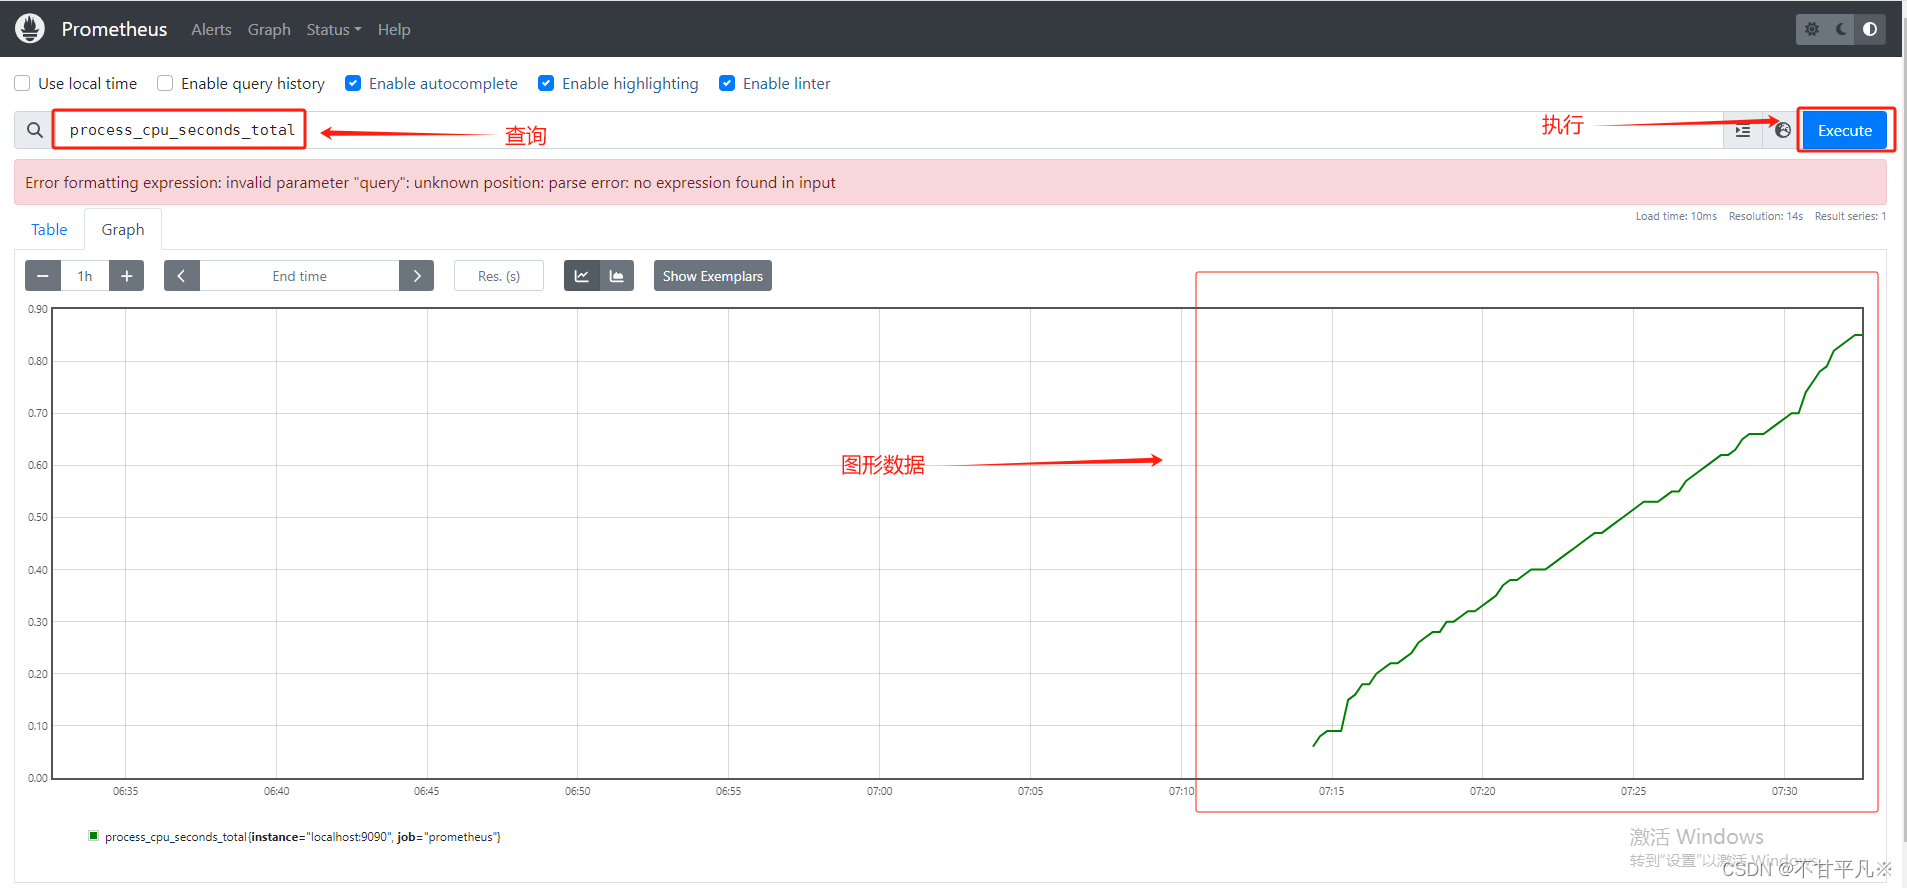
在web主界面可以通过关键字查询监控项
比如输入关键词:process_cpu_seconds_total
点击Execute执行,就会看出相应的图形数据
4、监控远程Linux主机
① 在远程linux主机(被监控端agent)上安装node_exporter组件,下载地址: https://prometheus.io/download/(可自行下载)
下载tar包
wget https://tongyf.oss-cn-shenzhen.aliyuncs.com/node_exporter-1.8.1.linux-amd64.tar.gz
解压
tar xf node_exporter-1.8.1.linux-amd64.tar.gz -C /usr/local/
mv /usr/local/node_exporter-1.8.1.linux-amd64/ /usr/local/node_exporter
里面就一个启动命令node_exporter,可以直接使用此命令启动
nohup /usr/local/node_exporter/node_exporter &
确认端口9100:
lsof -i:9100扩展: nohup命令: 如果把启动node_exporter的终端给关闭,那么进程也会随之关闭。nohup命令会帮你解决这个问题。
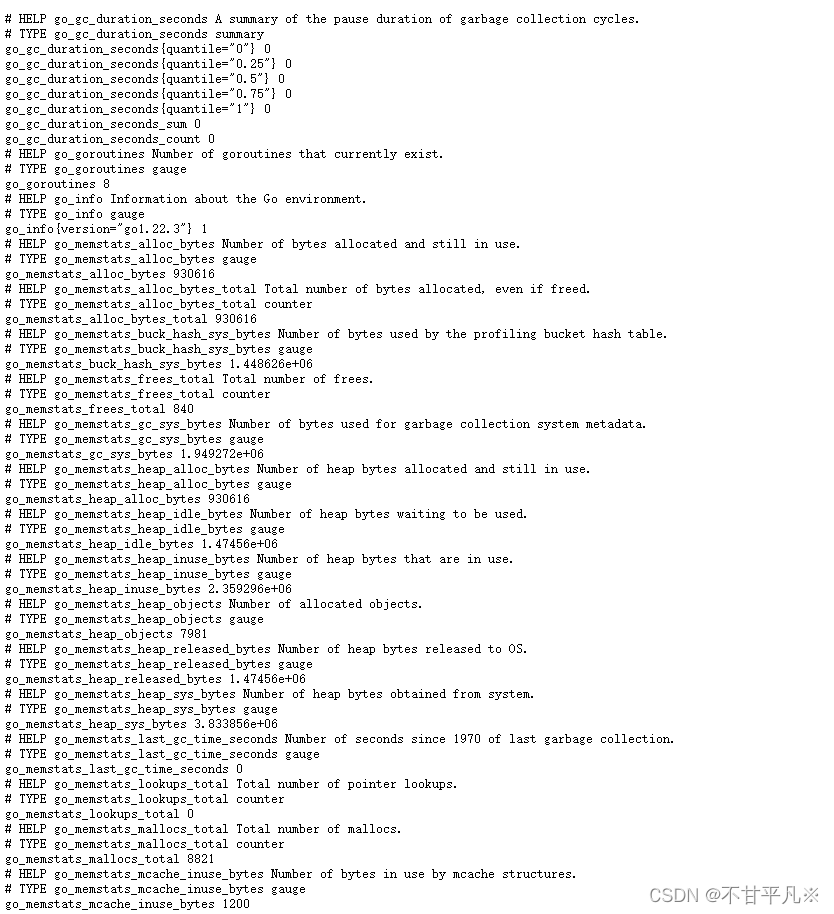
② 通过浏览器访问http://被监控端IP:9100/metrics就可以查看到node_exporter在被监控端收集的监控信息
③ 回到prometheus服务器的配置文件里添加被监控机器的配置段
在主配置文件最后加上下面三行
[root@prometheus]# vim /usr/local/prometheus/prometheus.yml
- job_name: 'agent' # 取一个job名称来代表被监控的机器
static_configs:
- targets: ['192.168.0.232:9100'] # 这里改成被监控机器的IP,后面端口接9100
关闭服务
pkill prometheus
确认端口没有进程占用
lsof -i:9090
重启服务
/usr/local/prometheus/prometheus --config.file="/usr/local/prometheus/prometheus.yml" &
确认端口被占用,说明重启成功
lsof -i:9090④ 回到web管理界面 --》点Status --》点Targets --》可以看到多了一台监控目标

5、监控远程MySQL
① 在被管理机agent1上安装mysqld_exporter组件,下载地址: https://prometheus.io/download/
下载tar包
wget https://tongyf.oss-cn-shenzhen.aliyuncs.com/mysqld_exporter-0.15.1.linux-amd64.tar.gz
解压
tar xf mysqld_exporter-0.15.1.linux-amd64.tar.gz -C /usr/local/
mv /usr/local/mysqld_exporter-0.15.1.linux-amd64/ /usr/local/mysqld_exporter切换目录至/usr/local/mysqld_exporter下,新增配置文件.my-exporter.cnf
[client]
user=exporter
password=Exporter1234!
host=127.0.0.1
port=3306
根据配置文件启动mysqld_exporter,并将数据暴露到9104端口,并且通过参数指定暴露的数据
./mysqld_exporter --web.listen-address=localhost:9104 --config.my-cnf=/usr/local/mysqld_exporter/.my-exporter.cnf --collect.auto_increment.columns --collect.binlog_size --collect.global_status --collect.engine_innodb_status --collect.global_variables --collect.info_schema.innodb_metrics --collect.info_schema.innodb_tablespaces --collect.info_schema.innodb_cmp --collect.info_schema.innodb_cmpmem --collect.info_schema.processlist --collect.info_schema.query_response_time --collect.info_schema.tables --collect.info_schema.tablestats --collect.info_schema.userstats --collect.perf_schema.eventswaits --collect.perf_schema.file_events --collect.perf_schema.indexiowaits --collect.perf_schema.tableiowaits --collect.perf_schema.tablelocks注册到系统服务
vim /etc/systemd/system/mysqld_exporter.service
[Unit]
Description=mysqld_exporter
After=network.target
[Service]
Type=simple
User=mysqld_exporter
ExecStart=/usr/local/mysqld_exporter/mysqld_exporter --config.my-cnf=/usr/local/mysqld_exporter/.my-exporter.cnf
Restart=on-failure
[Install]
WantedBy=multi-user.target
以服务的方式进行启动管理
添加用户
useradd --no-create-home --shell /bin/false mysqld_exporter
为用户赋予文件夹权限
chown -R mysqld_exporter:mysqld_exporter /usr/local/mysqld_exporter
重新加载系统配置
systemctl daemon-reload
开机启动
systemctl enable mysqld_exporter.service
启动服务
systemctl start mysqld_exporter
查看状态
systemctl status mysqld_exporter最后修改prometheus的配置文件,并重启
在主配置文件最后加上下面三行
[root@P=prometheus~]# vim /usr/local/prometheus/prometheus.yml
- job_name: 'mysql' # 取一个job名称来代表被监控的机器
static_configs:
- targets: ['192.168.0.232:9104'] # 这里改成被监控机器的IP,后面端口接9104关闭服务
pkill prometheus
确认端口没有进程占用
lsof -i:9090
重启服务
/usr/local/prometheus/prometheus --config.file="/usr/local/prometheus/prometheus.yml" &
确认端口被占用,说明重启成功
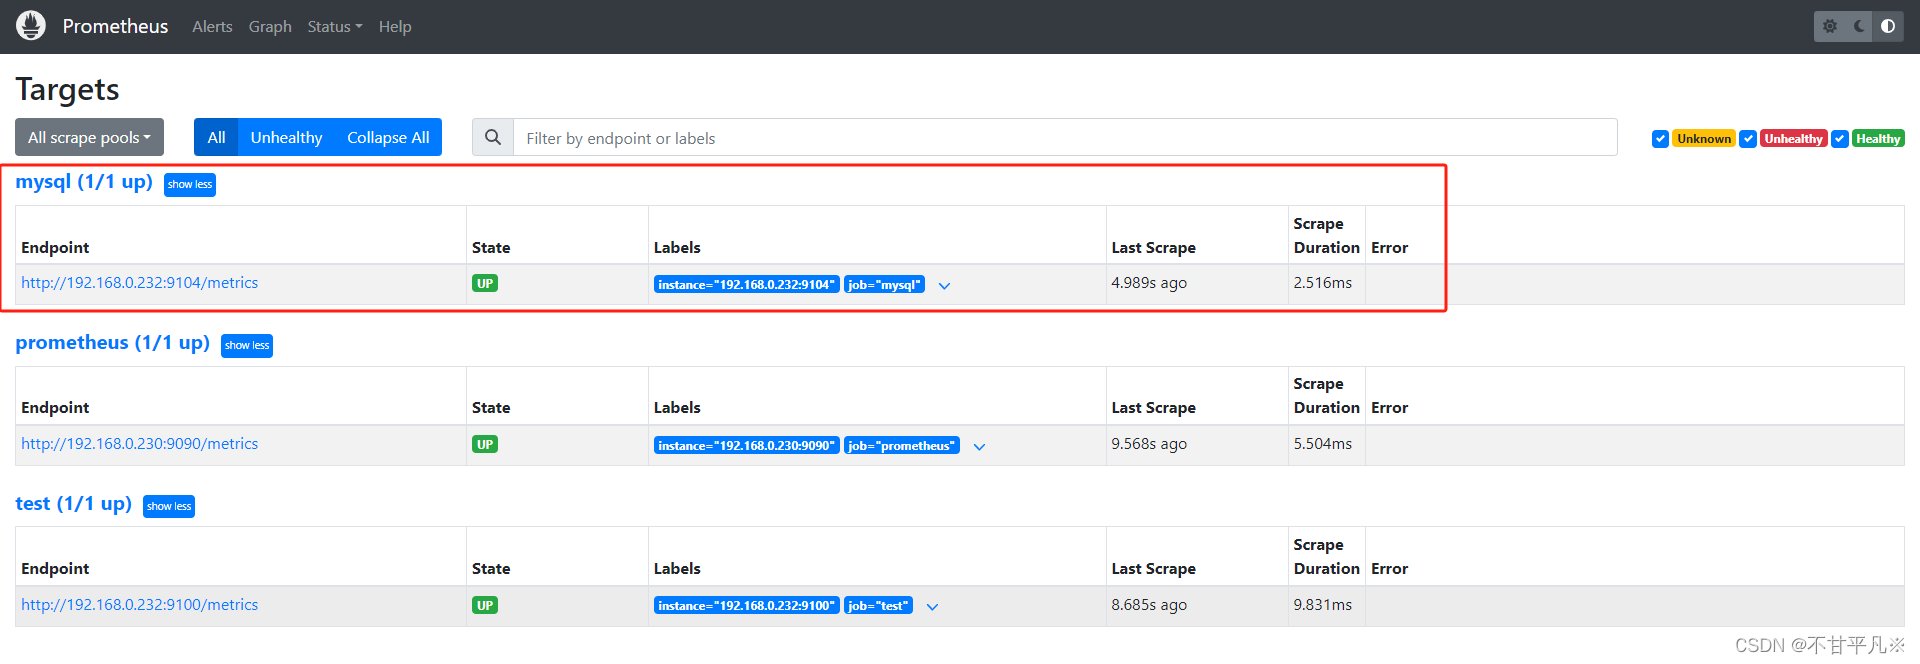
lsof -i:9090回到web管理界面 --》点Status --》点Targets --》可以看到多了一台监控目标

四、Grafana可视化图形工具
① 在grafana服务器上安装grafana
下载并安装
apt-get install -y adduser libfontconfig1 musl
wget https://dl.grafana.com/enterprise/release/grafana-enterprise_11.1.0_amd64.deb
dpkg -i grafana-enterprise_11.1.0_amd64.deb
出现报错
dpkg: error processing package ...原因:可能是dpkg管理的包信息出现了损坏
解决方法:通过sudo apt -f install进行修复
mv /var/lib/dpkg/info/ /var/lib/dpkg/info_old/
mkdir /var/lib/dpkg/info/
apt-get update
apt-get -f install
mv /var/lib/dpkg/info/* /var/lib/dpkg/info_old/
rm -rf /var/lib/dpkg/info
mv /var/lib/dpkg/info_old/ /var/lib/dpkg/info/
启动
systemctl daemon-reload
systemctl start grafana-server.service
systemctl status grafana-server.service
配置开展自动启动
systemctl enable grafana-server.servicegrafana汉化(在配置文件中注释并添加如下内容)
vim /etc/grafana/grafana.ini
#default_language = en-US
default_language = zh-Hans
重启服务,然后登陆查看
systemctl restart grafana-server.service② 通过浏览器访问 http:// grafana**服务器IP:3000**就到了登录界面,使用默认的admin用户,admin密码就可以登陆了

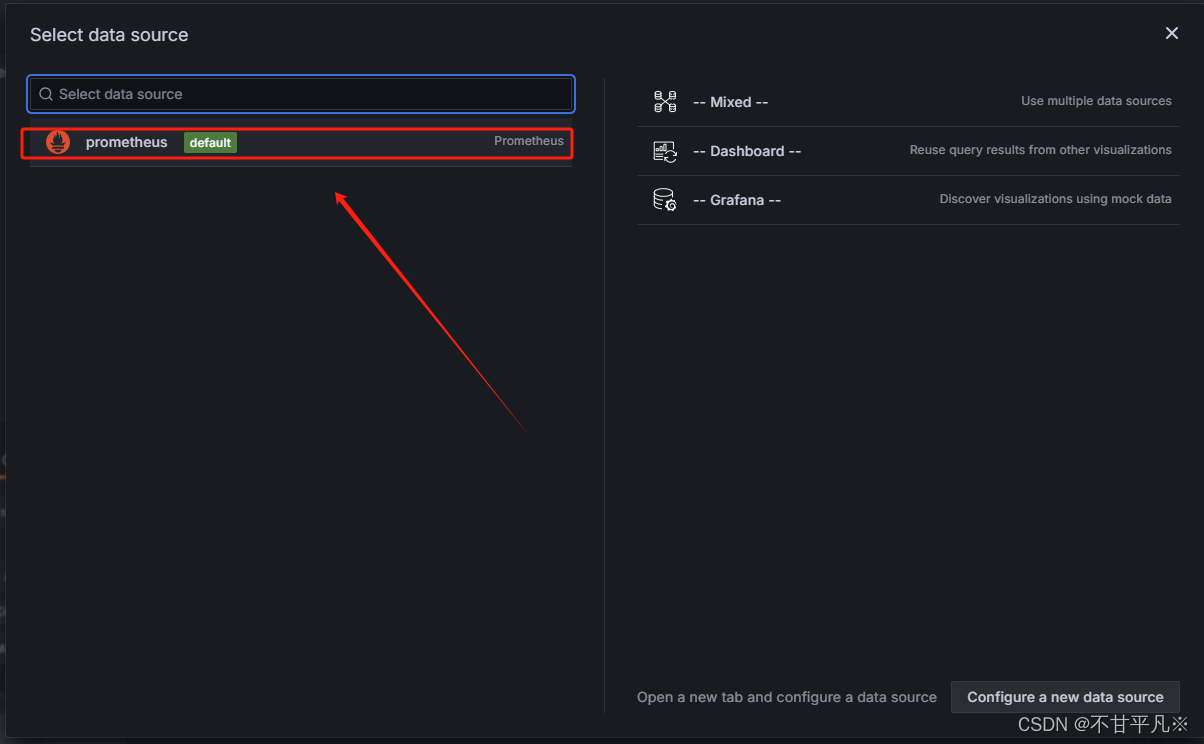
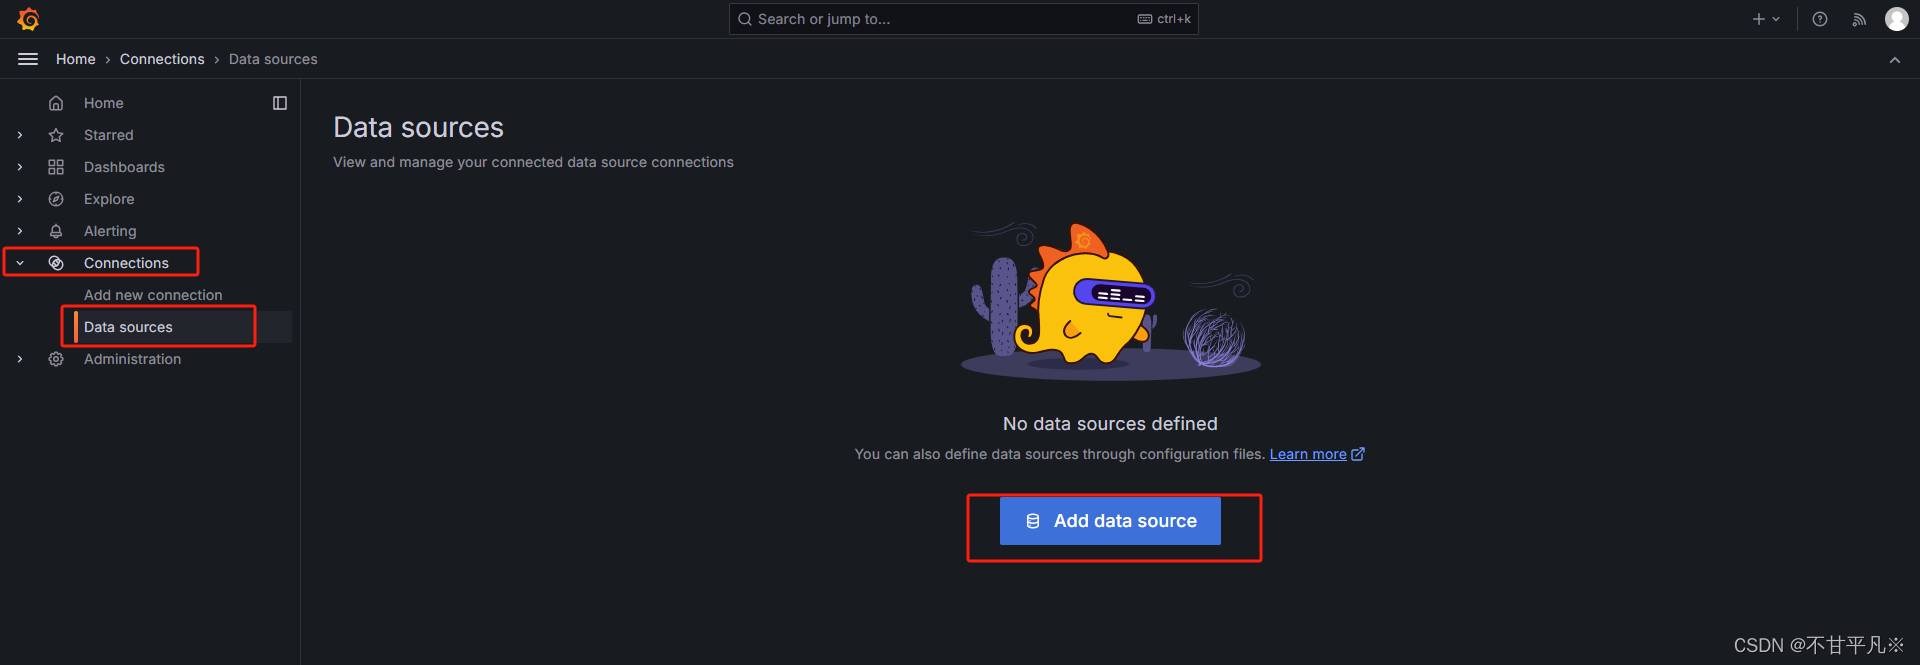
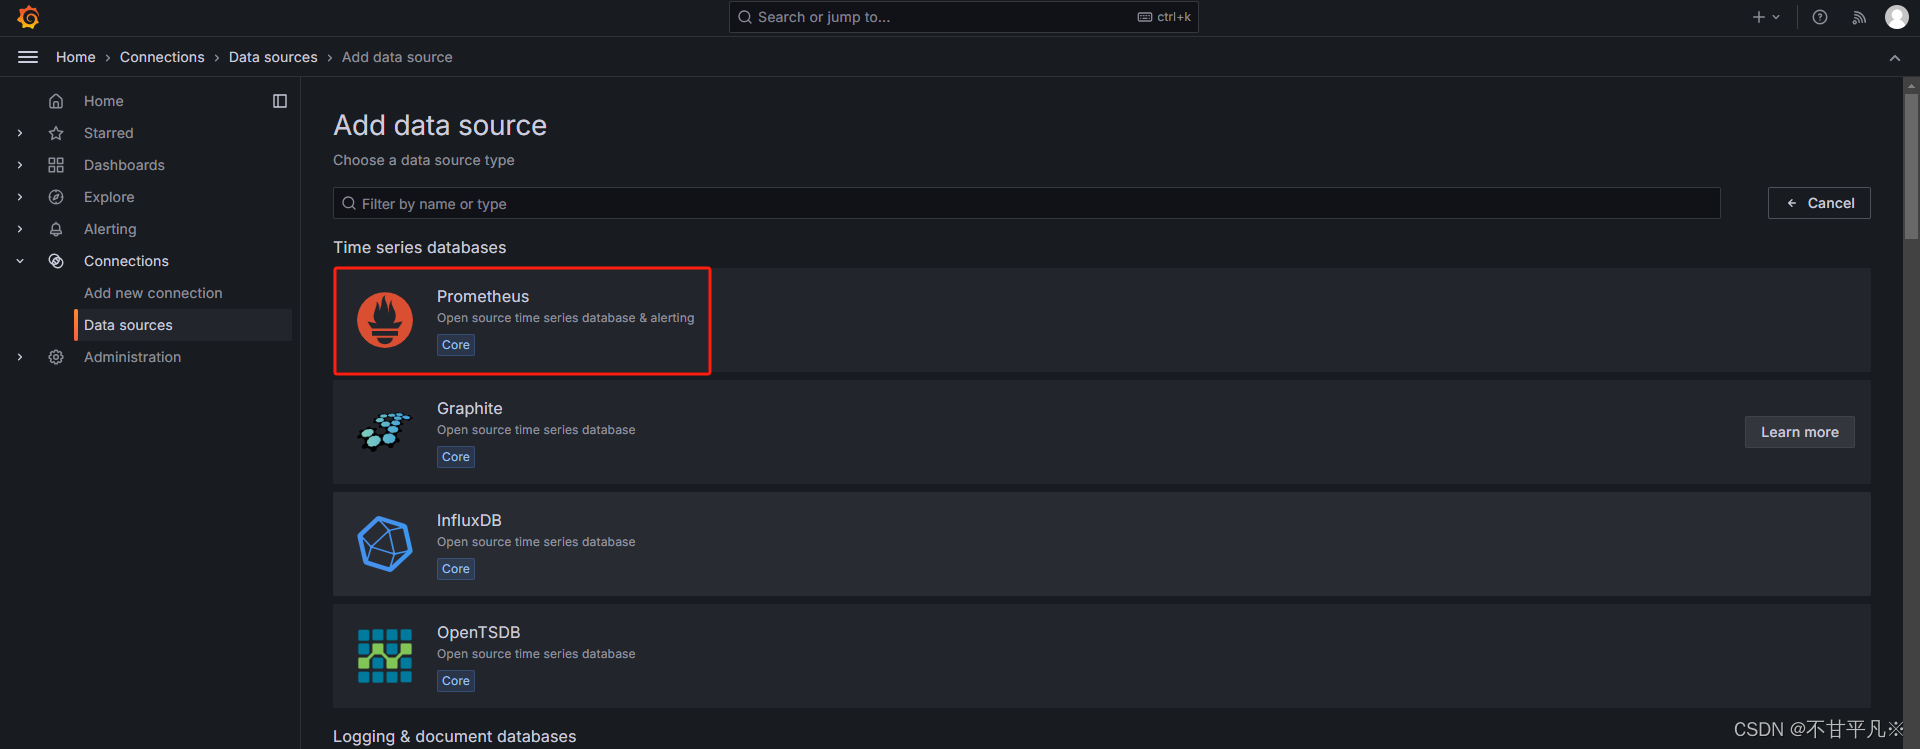
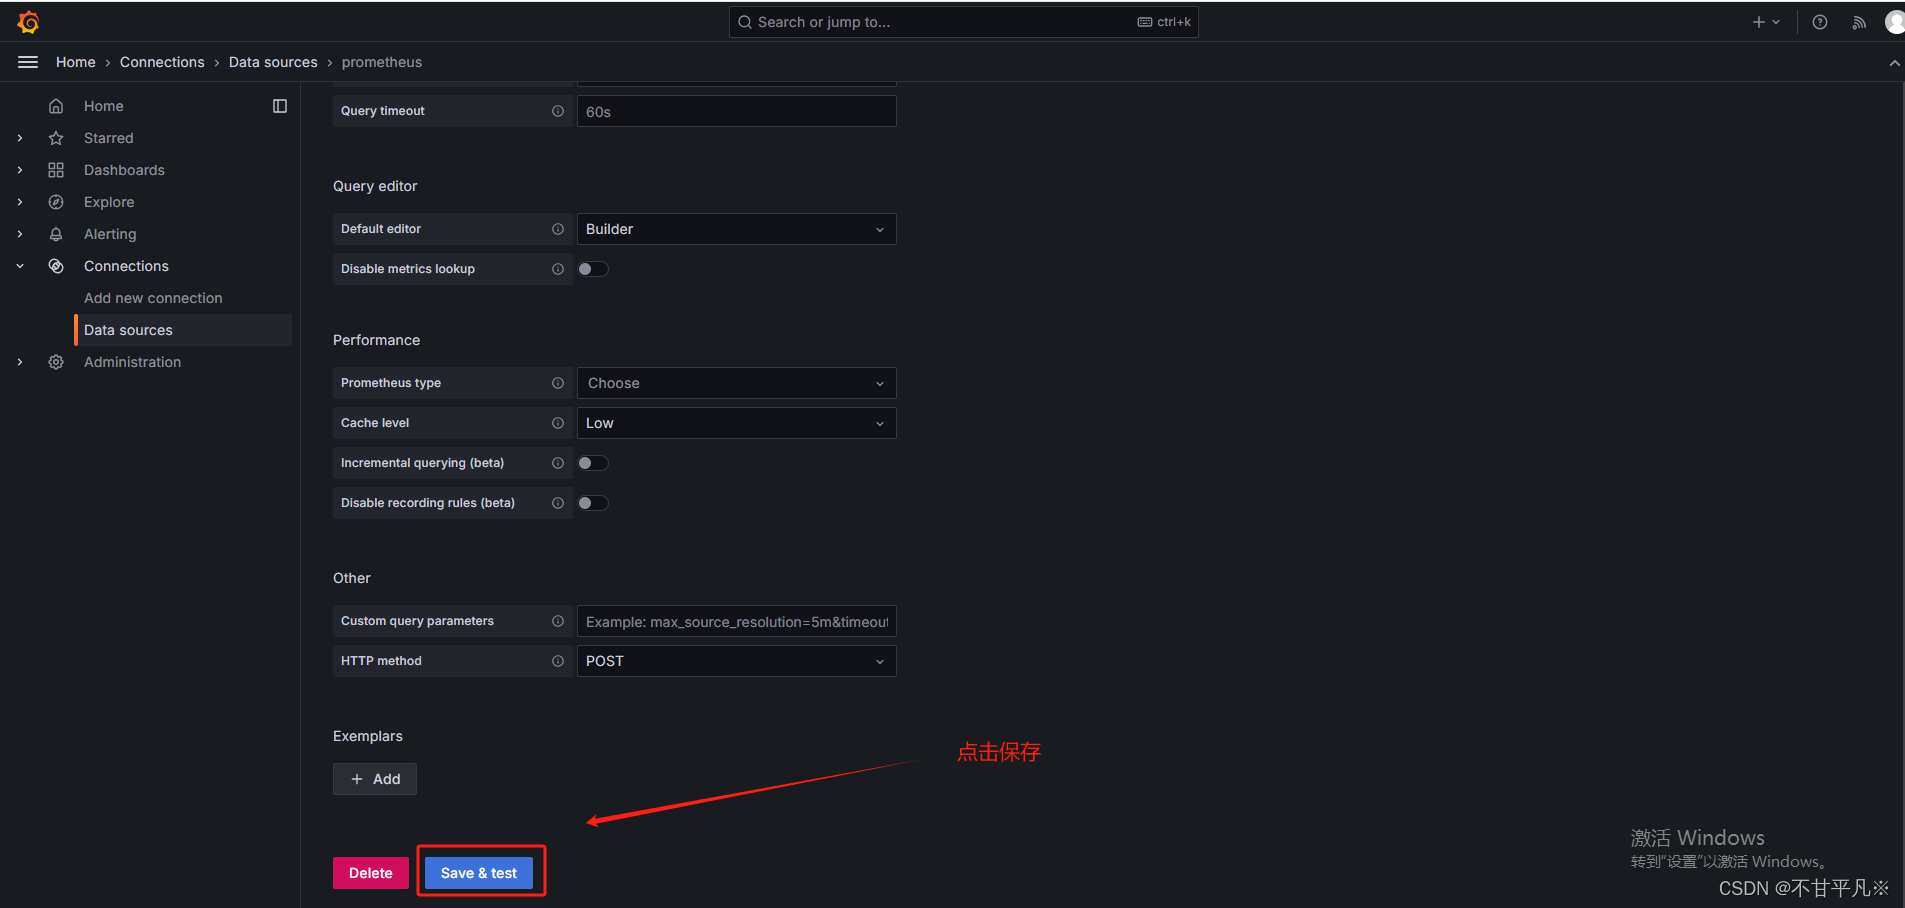
③ 下面我们把prometheus服务器收集的数据做为一个数据源添加到grafana,让grafana可以得到prometheus的数据。
登陆之后选择,左侧Configuration里面的DataSources
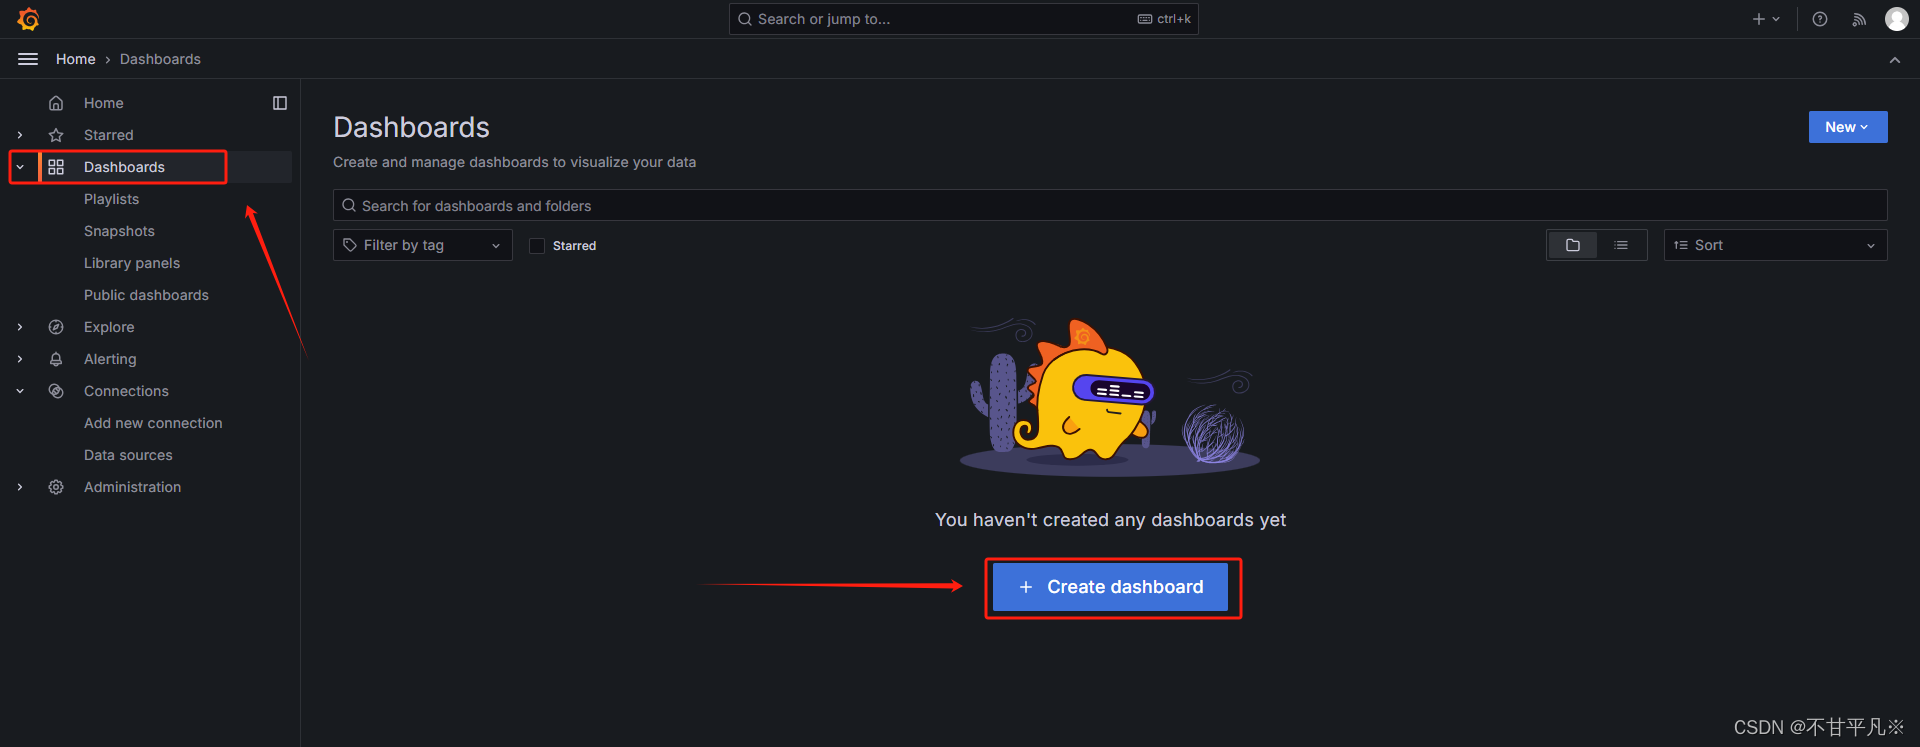

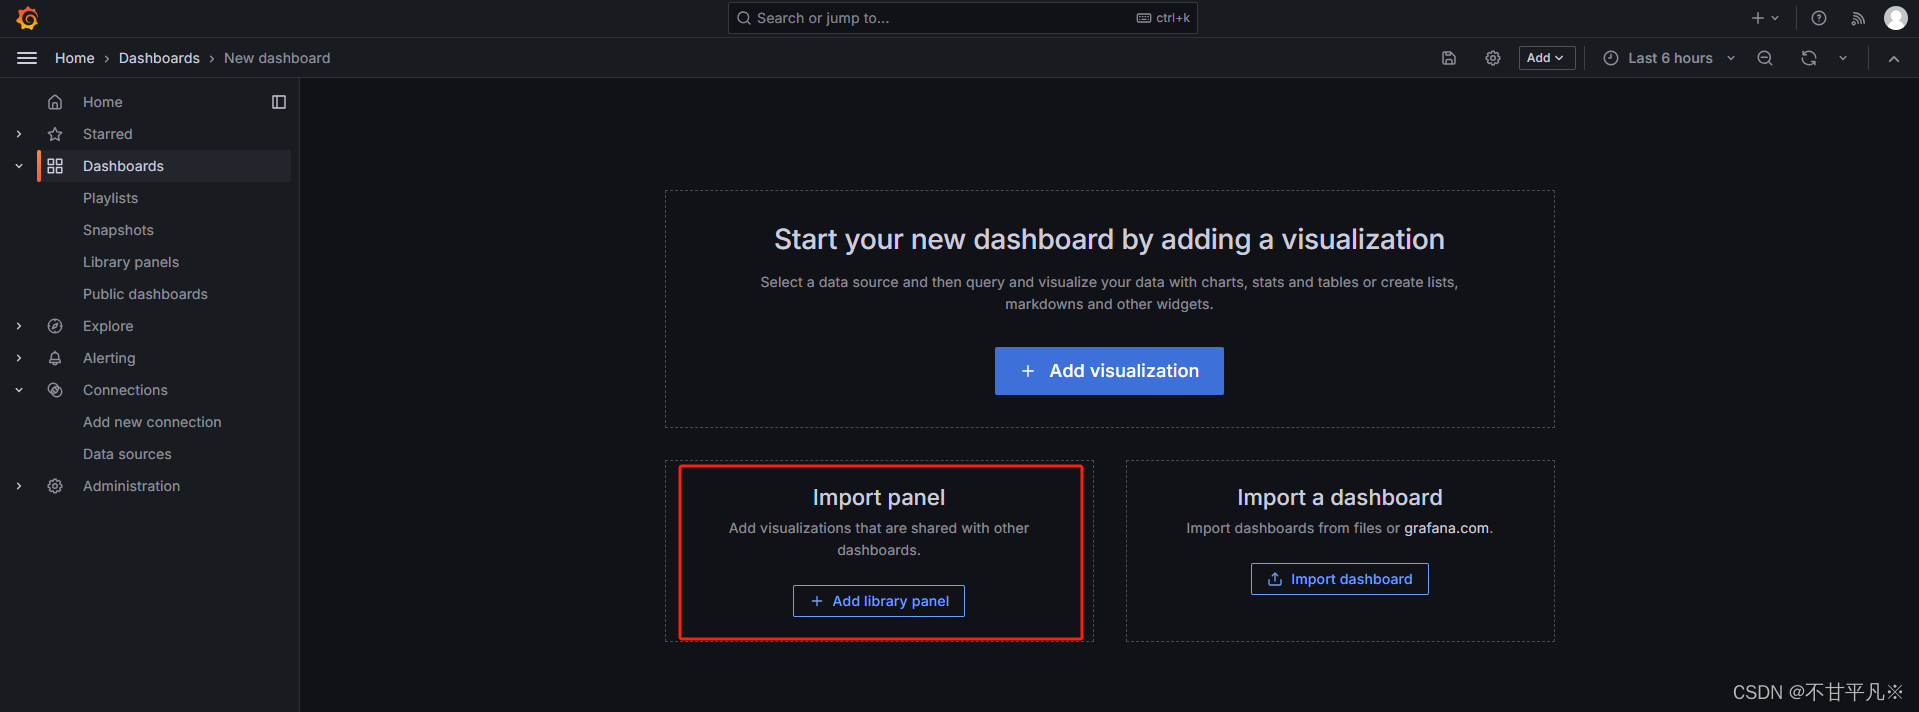
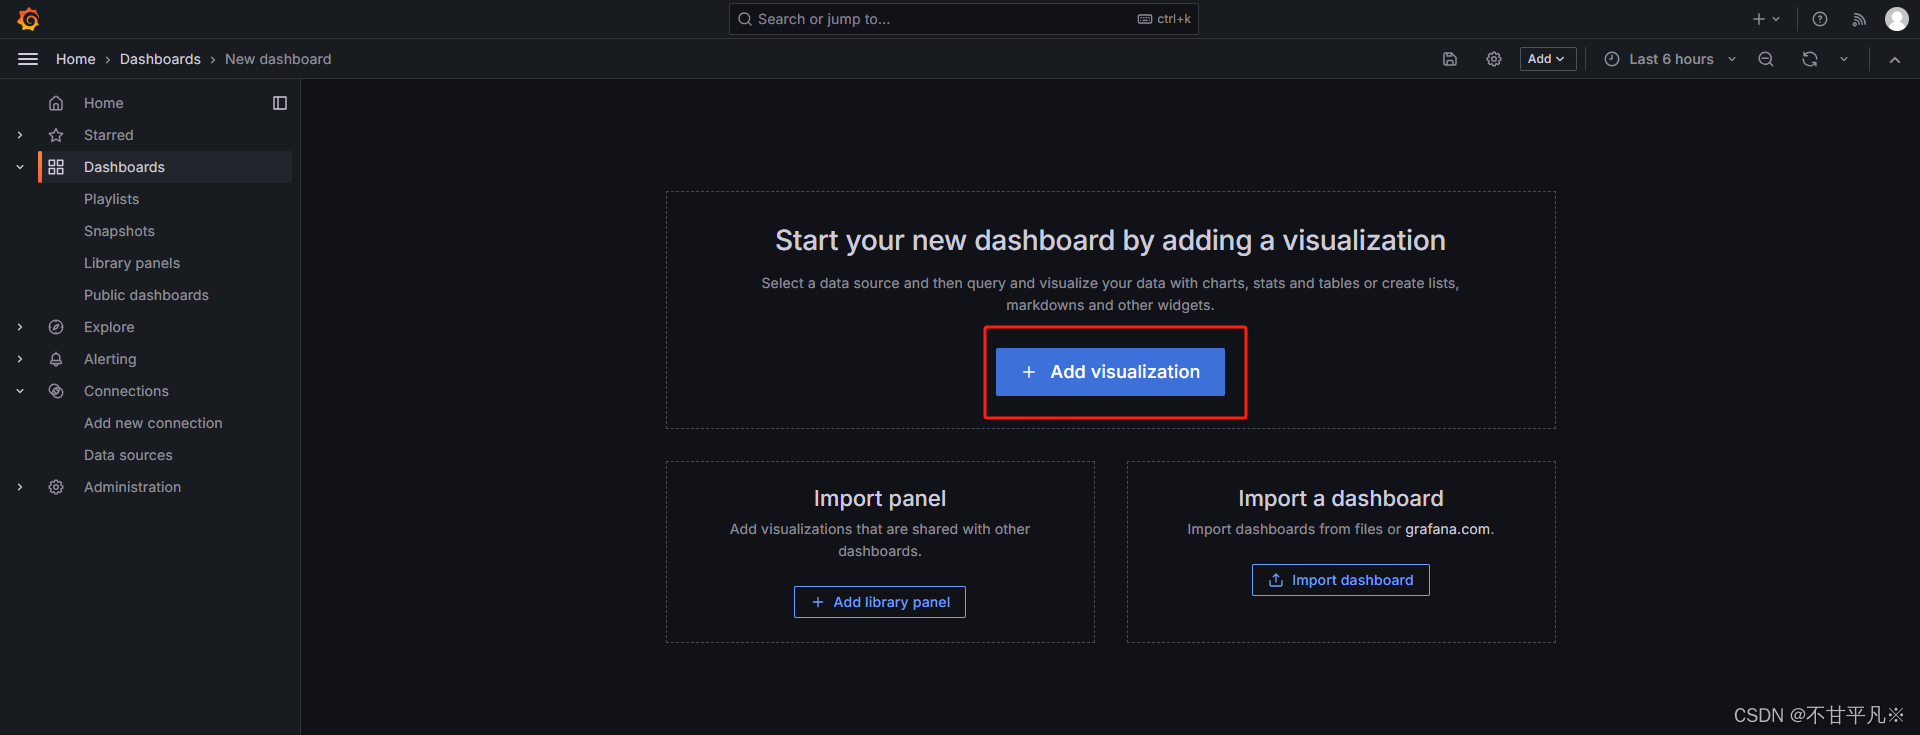
④点击Grafana首页侧边栏,Create DashBoard创建仪表盘