#TestD3{
  width: 100%;
  height: 35%;
  position: relative;

  .tooltip {
    opacity: 0;
    position: absolute;
    padding: 0.6em 1em;
    background: #fff;
    text-align: center;
    border: 1px solid #ddd;
    z-index: 10;
    transition: all 0.2s ease-out;
    pointer-events: none;
    transform: translate(-50%, calc(-100% - 14px));
  }

  .tooltip:before {
    content: '';
    position: absolute;
    bottom: 0;
    left: 50%;
    width: 12px;
    height: 12px;
    background: white;
    border: 1px solid #ddd;
    border-top-color: transparent;
    border-left-color: transparent;
    transform: translate(-50%, 50%) rotate(45deg);
    transform-origin: center center;
    z-index: 10;
  }

  .tooltip-range {
    margin-bottom: 0.2em;
    font-weight: 600;
  }
}
import './index.less';
import * as d3 from 'd3';
import { useEffect, useRef} from 'react';
import useAppState from "../../store";
const TestD3 = () => {
const svgRef = useRef(null); // 用于保存 SVG 元素的引用
const containerRef = useRef(null); // 用于保存父节点的引用
const {testData}=useAppState();
const draw = (width:number, height:number,dataset: any[]) => {
// 每次绘制前清除旧图表
d3.select('#TestD3').select('svg').remove();
let padding = 30;
const tooltip = d3.select('#tooltip');
let xScale = d3
.scaleBand()
.domain(d3.range(dataset.length))
.range([padding, width - padding])
.padding(0) // 设置柱子之间的间隙
.paddingInner(1); // 设置柱子内部的间隙
let yScale = d3
.scaleLinear()
.domain([0, d3.max(dataset, function (d) {
return d.value;
})])
.range([height - padding, padding]);
// 创建 SVG 元素并保存引用
const svg = d3
.select('#TestD3')
.append('svg')
.attr('width', width)
.attr('height', height)
svgRef.current = svg.node(); // 保存 SVG 元素的引用
let line = d3
.line()
.x(function (d, i) {
return xScale(i) + xScale.bandwidth() / 2;
})
.y(function (d) {
return yScale(d.value);
})
.curve(d3.curveCardinal);
svg
.append('path')
.datum(dataset)
.attr('class', 'line')
.attr('d', line)
.attr('fill', 'none')
.attr('stroke', '#69b3a2')
.attr('stroke-width', '3px');
let xAxis = d3
.axisBottom(xScale)
.tickFormat(function (d, i) {
return dataset[i].name;
});
let yAxis = d3.axisLeft(yScale);
svg
.append('g')
.attr('class', 'x-axis')
.attr('transform', 'translate(0,' + (height - padding) + ')')
.call(xAxis);
svg
.append('g')
.attr('class', 'y-axis')
.attr('transform', 'translate(' + padding + ',0)')
.call(yAxis);
// 绘制圆点
svg
.selectAll('.circle')
.data(dataset)
.enter()
.append('circle')
.attr('class', 'circle')
.attr('cx', function (d, i) {
return xScale(i) + xScale.bandwidth() / 2;
})
.attr('cy', function (d) {
return yScale(d.value);
})
.attr('r', 4)
.attr('fill', '#ffffff')
.attr('stroke', '#69b3a2')
.attr('stroke-width', '3px');
// 每个区域绘制一个矩形用于触发事件
let _w = (width - padding * 2) / (dataset.length - 1);
svg
.selectAll('.rect')
.data(dataset)
.enter()
.append('rect')
.attr('class', 'rect')
.attr('x', function (d, i) {
return xScale(i) - _w / 2;
})
.attr('y', padding)
.attr('width', _w)
.attr('height', height - padding * 2)
.attr('fill', 'transparent')
.on('mouseover', function (e,d) {
console.log(e,d)
tooltip.style('opacity', 1);
tooltip.select('#range').text(d.name);
tooltip.select('#count').text(d.value);
tooltip
.style('left', xScale(d.index) + xScale.bandwidth() / 2 + 'px')
.style('top', yScale(d.value) + 'px');
})
.on('mouseout', function (d) {
tooltip.style('opacity', 0);
});
};
useEffect(() => {
if(containerRef.current){
const { width, height } = containerRef.current.getBoundingClientRect();
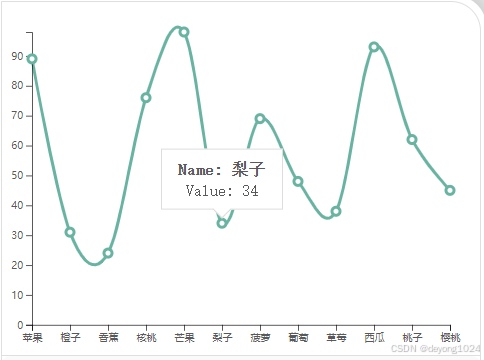
let dataset = [
{ name: '苹果', value: 50,index:0 },
{ name: '橙子', value: 30,index:1 },
{ name: '香蕉', value: 70,index:2 },
{ name: '核桃', value: 20,index:3 },
{ name: '芒果', value: 60,index:4 },
{ name: '梨子', value: 100,index:5 },
{ name: '菠萝', value: 80,index:6 },
{ name: '葡萄', value: 90,index:7 },
{ name: '草莓', value: 35,index:8 },
{ name: '西瓜', value: 75,index:9 },
{ name: '桃子', value: 55,index:10 },
{ name: '樱桃', value: 25,index:11 },
];
dataset.forEach(function (d) {
d.value = Math.floor(Math.random() * 80) + 20;
});
draw(width,height,dataset);
}
}, [testData]);
return (
<>
<div id="TestD3" ref={containerRef}>
<div id="tooltip" className="tooltip">
<div className="tooltip-range">
Name: <span id="range"></span>
</div>
<div className="tooltip-value">
Value: <span id="count"></span>
</div>
</div>
</div>
</>
);
};
export default TestD3;