import numpy as np
from scipy import stats

# r = stats.linregress(xs, ys) 是一个用于执行简单线性回归的函数,通常来自 scipy.stats 库。

# 具体含义如下:

# stats.linregress:执行线性回归分析,拟合一条最佳直线来描述两个变量 xs 和 ys 之间的关系。
# xs:自变量(输入变量),是一个数组。
# ys:因变量(输出变量),是一个数组。
# r:返回的回归结果对象,包含以下信息:
# slope:回归直线的斜率。
# intercept:回归直线的截距。
# rvalue:相关系数(衡量变量之间的线性相关性)。
# pvalue:斜率的 p 值(用于检验斜率是否显著不为零)。
# stderr:斜率的标准误差。


# 示例数据
xs = np.array([1, 2, 3, 4, 5])
ys = np.array([2, 4, 5, 4, 5])

# 执行线性回归
r = stats.linregress(xs, ys)

# 输出结果
print("斜率:", r.slope)
print("截距:", r.intercept)
print("相关系数:", r.rvalue)
斜率: 0.6000000000000001
截距: 2.1999999999999997
相关系数: 0.7745966692414835
# 该函数会返回一个包含多个统计信息的对象,通常将其赋值给一个变量(这里是 r)。这个对象包含以下几个属性:
# r.slope:直线的斜率,也就是线性方程
# y=mx+b
#  中的
# m
# 。
# r.intercept:直线的截距,即线性方程
# y=mx+b
#  中的
# b
# 。
# r.rvalue:相关系数,衡量了自变量和因变量之间线性关系的强度和方向,取值范围是 -1 到 1。
# r.pvalue:用于检验斜率是否显著不为零的 p 值。如果 p 值很小(通常小于 0.05),则表明自变量和因变量之间存在显著的线性关系。
# r.stderr:斜率的标准误差,用于衡量斜率估计的不确定性。

import numpy as np
from scipy import stats

# 示例数据
xs = np.array([1, 2, 3, 4, 5])
ys = np.array([2, 4, 6, 8, 10])

# 执行线性回归分析
r = stats.linregress(xs, ys)

# 输出结果
print(f"斜率: {r.slope}")
print(f"截距: {r.intercept}")
print(f"相关系数: {r.rvalue}")
print(f"p 值: {r.pvalue}")
print(f"斜率的标准误差: {r.stderr}")
斜率: 2.0
截距: 0.0
相关系数: 1.0
p 值: 1.2004217548761408e-30
斜率的标准误差: 0.0
σ = ∑ ( x i − μ ) 2 N \sigma = \sqrt{\frac{\sum (x_i - \mu)^2}{N}} σ=N∑(xi−μ)2
Sample Standard Deviation:
s = ∑ ( x i − x ‾ ) 2 n − 1 s = \sqrt{\frac{\sum (x_i - \overline{x})^2}{n-1}} s=n−1∑(xi−x)2
import matplotlib.pyplot as plt
import matplotlib as mpl
import numpy as np
from scipy import stats


mpl.rcParams['font.sans-serif'] = ['SimHei']

xs = range(0,501) # 500分钟
ys = [30] # 0分钟时的初始y值(y代表股票价格)

# 随机数播种机设定seed=42,不同的seed产生的随机数列不同,
# 你多运行几次会发现相同的seed产生的一样的随机数列,输出的图表相同。
np.random.seed(seed=42)

for delta in np.random.normal(0,0.5,500):
    # delta是从上一个y到下一个y的波动
    ys.append(ys[-1] + delta)

# 这个函数能把相对应的x 对应的y的数据给整出来  斜率,截距
r = stats.linregress(xs, ys)  # 计算两组测量值xs, ys的线性最小二乘回归。
""" linregress 返回的r 有几个属性:
slope (float)
    Slope of the regression line. 线性回归曲线的斜率Slope
intercept (float)
    Intercept of the regression line. 线性回归曲线的纵截距intercept
......
"""
# r.slope:线性回归曲线的斜率。
# r.intercept:线性回归曲线的纵截距。

# 我们都知道 y = mx + b

# r.slope 对应m   r.intercept 对应的是b

# 利用一段for循环遍历x 从xs的起点到末点

line = [r.slope * x + r.intercept for x in xs]  # 获得线性回归曲线的各点纵坐标


#  zip() 的作用 得到一个(ys,line)
# ys = [1, 2, 3]
# line = [1.1, 2.2, 3.3]
# for pair in zip(ys, line):
#     print(pair)

# 输出
# (1, 1.1)
# (2, 2.2)
# (3, 3.3)

# (y - y0) for y, y0 in zip(ys, line)
# 这是一个列表推导式,它会遍历 zip(ys, line) 生成的每个元组 (y, y0),其中 y 是原始数据 ys 中的元素,y0 是线性回归曲线 line 中对应位置的元素。对于每一对元素,计算它们的差值 y - y0,最终将所有差值组成一个新的列表。


std = np.std([(y-y0) for y,y0 in zip(ys,line)]) # 计算标准差


# 相当于top 是y 总体上移了标准差
top = [y + std for y in line]  # 回归曲线纵坐标上移标准差std

# 相当于bottom 总体下移了标准差
bottom = [y - std for y in line]  # 下移std


plt.plot(xs, ys, color = 'blue', label = '原数据')  # 原数据
plt.plot(xs, line, color='red', label='线性回归曲线' )  # 线性回归曲线
plt.plot(xs, top, color='green', label='上浮动')
plt.plot(xs, bottom, color='orange', label='下浮动')

plt.ylabel('Stock Price ($)')
plt.xlabel('Elapsed Time (min)')
plt.legend()
plt.savefig('figures/1-3.svg')

import matplotlib.pyplot as plt
import matplotlib as mpl
import numpy as np
from scipy import stats

# 英里里程
mileages = [4.1429, 8.9173, 6.5, 6.0601, 12.3, 6.2, 2.5782, 0.9, 1.7, 13.1045, 24.7, 9.2699, 17.2, 10.0, 10.0, 2.8, 12.3773, 19.6, 7.3397,
            2.1178, 12.9886, 10.9884, 16.9, 6.0, 12.9, 8.1936, 10.5, 8.0713, 1.7, 10.0, 15.6097, 17.0, 16.7, 5.6, 11.3, 19.9, 9.6, 21.6, 20.3]
# 对应二手车价格
prices = [16980.0, 15973.0, 9900.0, 15998.0, 3900.0, 12540.0, 21688.0, 17086.0, 23000.0, 8900.0, 3875.0, 10500.0, 3500.0, 26992.0, 17249.0, 19627.0, 9450.0, 3000.0, 14999.0,
          24990.0, 7967.0, 7257.0, 4799.0, 13982.0, 5299.0, 14310.0, 7800.0, 12250.0, 23000.0, 14686.0, 7495.0, 4950.0, 3500.0, 11999.0, 9600.0, 1999.0, 4300.0, 3500.0, 4200.0]


# 指数拟合曲线,这里居然直接写出来,没给出算法
def price(mileage):
    return 26500 * (0.905 ** mileage)

xs = np.linspace(0,25,100)
ys = price(xs) # xs对应的拟合曲线纵坐标

plt.scatter(mileages,prices)  # 原数据散点图
plt.plot(xs,ys, color='C1')  # 拟合曲线折线图
plt.xlabel('Mileage (10,000s of miles)')
plt.ylabel('Price ($)')
plt.savefig('figures/1-5.svg')

import matplotlib.pyplot as plt

# 示例数据
x = [1, 2, 3, 4, 5]
y = [2, 4, 6, 8, 10]

# 绘制原始数据
plt.plot(x, y)

# 绘制辅助线
plt.plot([-5, 30], [10000, 10000], color="gray", linestyle="dashed")

# 显示图形
plt.show()

import matplotlib.pyplot as plt
import matplotlib as mpl
import numpy as np
from scipy import stats


# 英里里程
mileages = [4.1429, 8.9173, 6.5, 6.0601, 12.3, 6.2, 2.5782, 0.9, 1.7, 13.1045, 24.7, 9.2699, 17.2, 10.0, 10.0, 2.8, 12.3773, 19.6, 7.3397,
            2.1178, 12.9886, 10.9884, 16.9, 6.0, 12.9, 8.1936, 10.5, 8.0713, 1.7, 10.0, 15.6097, 17.0, 16.7, 5.6, 11.3, 19.9, 9.6, 21.6, 20.3]
# 对应二手车价格
prices = [16980.0, 15973.0, 9900.0, 15998.0, 3900.0, 12540.0, 21688.0, 17086.0, 23000.0, 8900.0, 3875.0, 10500.0, 3500.0, 26992.0, 17249.0, 19627.0, 9450.0, 3000.0, 14999.0,
          24990.0, 7967.0, 7257.0, 4799.0, 13982.0, 5299.0, 14310.0, 7800.0, 12250.0, 23000.0, 14686.0, 7495.0, 4950.0, 3500.0, 11999.0, 9600.0, 1999.0, 4300.0, 3500.0, 4200.0]

# 指数拟合曲线,这里居然直接写出来,没给出算法
def price(mileage):
    return 26500 * (0.905 ** mileage)


xs = np.linspace(0, 25, 100)
ys = price(xs)

# 这是在计算预算10000美元下的里程数是多少,看到书P5中间
target_mileage = np.log(10/26.5)/np.log(0.905)

plt.scatter(mileages, prices)
plt.plot(xs, ys, color='C1')

# 记录下原来的坐标系x范围和y范围,避免绘制辅助线时导致范围扩大,
# 不信你把这一行和后面的 plt.xlim(*xlim) plt.ylim(*ylim) 都注释掉看看
xlim, ylim = plt.xlim(), plt.ylim()

# 绘制连接(-5, 10000)和(30, 10000)的虚(dashed)折线, 辅助线使用了灰色gray保持低调
plt.plot([-5, 30], [10000, 10000], color="gray", linestyle="dashed")
# 绘制纵向的辅助折线,从(target_mileage, -5000)到(target_mileage, 10000)
plt.plot([target_mileage, target_mileage], [-5000, 10000], color="gray", linestyle="dashed")

# 保持原坐标系大小
plt.xlim(*xlim)
plt.ylim(*ylim)
# x, y轴要标注好, 最后保存起来
plt.xlabel('Mileage (10,000s of miles)')
plt.ylabel('Price ($)')
plt.savefig('figures/1-6.svg')

import sys # sys模块提供了系统相关的参数和函数
sys.path.append(r'C:\Users\XXXXXX\Xiyong\python test\Math-for-Programmers-zh-master\Chapter 03') # 这里在处理python环境的sys.path中添加了../Chapter 03 (../ 代表该文件夹的父文件夹 Math-for-Programmers-zh/ ,Chapter 03 在 Math-for-Programmers-zh/ 中)

from draw3d import * # 由于../Chapter 03已经在环境变量中,从 ../Chapter 03/drwa3d中导入所有的函数和变量

sys.path # 我来查看环境变量, 最后一个是我们已经添加进来的了../Chapter 03

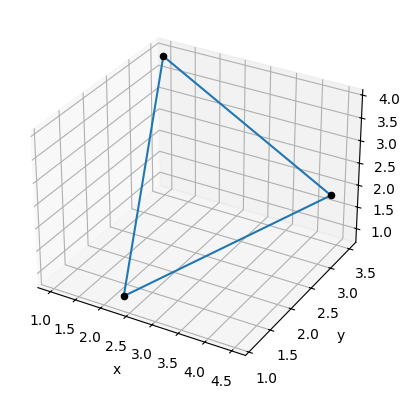
triangle = [(2.3,1.1,0.9), (4.5,3.3,2.0), (1.0,3.5,3.9)]

# 绘制triangle的三个点的连线,具体以后会知道的😁
draw3d(
    Polygon3D(*triangle),
    Points3D(*triangle),
    axes=False,
    origin=False,
    save_as='figures/1-8.svg'
)

们已经添加进来的了…/Chapter 03
triangle = [(2.3,1.1,0.9), (4.5,3.3,2.0), (1.0,3.5,3.9)]
绘制triangle的三个点的连线,具体以后会知道的😁
draw3d(
Polygon3D(*triangle),
Points3D(*triangle),
axes=False,
origin=False,
save_as=‘figures/1-8.svg’
)
