        <dependency>
            <groupId>org.springframework.boot</groupId>
            <artifactId>spring-boot-starter-actuator</artifactId>
        </dependency>
        <dependency>
            <groupId>io.micrometer</groupId>
            <artifactId>micrometer-registry-prometheus</artifactId>
        </dependency>
MetricsInitializer.java

import io.prometheus.client.CollectorRegistry;
import org.springframework.boot.CommandLineRunner;
import org.springframework.stereotype.Component;

@Component
public class MetricsInitializer implements CommandLineRunner {

    private final CollectorRegistry collectorRegistry;

    public MetricsInitializer(CollectorRegistry collectorRegistry) {
        this.collectorRegistry = collectorRegistry;
    }

    @Override
    public void run(String... args) throws Exception {
        // 初始化所有指标
        MetricsExporter.initializeMetrics(collectorRegistry);
    }
}
方式一、
import io.prometheus.client.CollectorRegistry;
import io.prometheus.client.Counter;
import io.prometheus.client.Gauge;
import io.prometheus.client.Histogram;
import org.springframework.beans.BeansException;
import org.springframework.context.ApplicationContext;
import org.springframework.context.ApplicationContextAware;
import org.springframework.stereotype.Component;


@Component
public class PrometheusComponent implements ApplicationContextAware {
    private static PrometheusComponent instance;


    /**
     * 请求总数
     */
    private Counter reqCounter;

    /**
     * 正在请求的http数量
     */
    private Gauge duringReqGauge;

    /**
     * 直方图,请求分布情况
     */
    private Histogram reqLatencyHistogram;

    @Override
    public void setApplicationContext(ApplicationContext applicationContext) throws BeansException {
        instance = this;
        CollectorRegistry collectorRegistry = applicationContext.getBean(CollectorRegistry.class);
        // 这里指定SpringBoot容器的CollectorRegistry,如果使用默认的会导致无法收集
        reqCounter = Counter.build().name("demo_rest_req_total").labelNames("path", "method", "code")
                .help("总的请求计数").register(collectorRegistry);
        duringReqGauge = Gauge.build()
                .name("demo_rest_inprogress_req").labelNames("path", "method")
                .help("正在处理的请求数").register(collectorRegistry);
        reqLatencyHistogram = Histogram.build().labelNames("path", "method", "code")
                .name("demo_rest_requests_latency_seconds_histogram").help("请求耗时分布")
                .register(collectorRegistry);
    }

    public static PrometheusComponent getInstance() {
        return instance;
    }

    public Counter counter() {
        return reqCounter;
    }

    public Gauge gauge() {
        return duringReqGauge;
    }

    public Histogram histogram() {
        return reqLatencyHistogram;
    }
MetricsExporter.java


import io.prometheus.client.*;

/**
 * 封装 Prometheus 指标的工具类
 */
public class MetricsExporter {

    public static final String SUCCESS = "success";
    public static final String FAILED = "failed";

    /**
     * Redis 处理时间统计
     */
    private static Summary redisProcessTimeInMs;

    /**
     * MySQL 处理完成时间分布
     */
    private static Summary mysqlProcessInMs;

    /**
     * 不同标签统计数量预警
     */
    public static final String NO_FOOD = "无菜品";

    private static Counter warningLabelCounter;

    /**
     * MQ 业务处理时间统计
     */
    private static Summary mqBusinessProcessTimeInMs;

    /**
     * MQ 当前处理数量
     */
    private static Gauge orderAcceptGauge;

    /**
     * 请求总数
     */
    private static Counter reqCounter;

    /**
     * 正在处理的请求数
     */
    private static Gauge duringReqGauge;

    /**
     * 请求耗时分布
     */
    private static Histogram reqLatencyHistogram;

    /**
     * 初始化所有指标
     */
    public static void initializeMetrics(CollectorRegistry collectorRegistry) {
        redisProcessTimeInMs = Summary.build()
                .name("redis_process_time_milliseconds")
                .labelNames("method", "status")
                .help("Redis 处理完成时间分布(毫秒)")
                .register(collectorRegistry);

        mysqlProcessInMs = Summary.build()
                .name("mysql_process_time_milliseconds")
                .labelNames("method", "status")
                .help("MySQL 处理完成时间分布(毫秒)")
                .register(collectorRegistry);

        warningLabelCounter = Counter.build()
                .name("warning_label_count")
                .labelNames("label")
                .help("不同标签统计数量预警")
                .register(collectorRegistry);

        mqBusinessProcessTimeInMs = Summary.build()
                .name("mq_business_process_time_milliseconds")
                .labelNames("msgType", "status")
                .help("MQ 业务处理完成时间分布(毫秒)")
                .register(collectorRegistry);

        orderAcceptGauge = Gauge.build()
                .name("order_accept_current_gauge")
                .labelNames("msgType")
                .help("RabbitMQ 接收消息的当前处理数量")
                .register(collectorRegistry);

        reqCounter = Counter.build()
                .name("demo_rest_req_total")
                .labelNames("path", "method", "code")
                .help("总的请求计数")
                .register(collectorRegistry);

        duringReqGauge = Gauge.build()
                .name("demo_rest_inprogress_req")
                .labelNames("path", "method")
                .help("正在处理的请求数")
                .register(collectorRegistry);

        reqLatencyHistogram = Histogram.build()
                .labelNames("path", "method", "code")
                .name("demo_rest_requests_latency_seconds_histogram")
                .help("请求耗时分布")
                .register(collectorRegistry);
    }

    public static Summary getRedisProcessTimeInMs() {
        return redisProcessTimeInMs;
    }

    public static Summary getMysqlProcessInMs() {
        return mysqlProcessInMs;
    }

    public static Counter getWarningLabelCounter() {
        return warningLabelCounter;
    }

    public static Summary getMqBusinessProcessTimeInMs() {
        return mqBusinessProcessTimeInMs;
    }

    public static Gauge getOrderAcceptGauge() {
        return orderAcceptGauge;
    }

    public static Counter getReqCounter() {
        return reqCounter;
    }

    public static Gauge getDuringReqGauge() {
        return duringReqGauge;
    }

    public static Histogram getReqLatencyHistogram() {
        return reqLatencyHistogram;
    }
}
指标grafana使用 private static final Gauge DAILY_PROCESS_MSG_COUNT = Gauge.build() .name("mq_daily_process_v2_gauge") .labelNames("msgType", "direction") .help("记录当前延迟消息数量") .register(); Metrices: sum(mq_daily_process_v2_gauge) by (msgType,direction) Legend: {{msgType}}-{{direction}} Metrices: sum(mq_daily_process_v2_gauge) by (msgType) Legend: {{msgType}} //mq 过滤时间统计 private static final Summary mqProcessTimeInMs = Summary.build() .name("mq_process_time_milliseconds") .labelNames("queueName", "status") .help("mq process completed time in milliseconds") .register(); 云店各机房处理消息对比 Metrices: sum(rate(mq_process_time_milliseconds_count{queueName!~".*YunDian.*"}[2m])) by (k8s_cluster) Legend: 接收 - {{k8s_cluster}} Metrices: sum(rate(mq_business_process_time_milliseconds_count[2m]) * -20) by (k8s_cluster) Legend: 处理(*-20) - {{k8s_cluster}} 云店收到消息趋势 / 2m Metrices: sum(rate(mq_process_time_milliseconds_count[2m])) Legend: Metrices:sum(rate(mq_process_time_milliseconds_count{queueName!~".*YunDian.*"}[2m])) by (queueName) Legend: {{queueName}} MQ 平均耗时前十的队列名称 / 1H Metrices: topk(10, sum(rate(mq_process_time_milliseconds_sum{pod_name=~"$pod"}[1h]) / (rate(mq_process_time_milliseconds_count{pod_name=~"$pod"}[1h])) > 0) by (queueName,status)) Legend: mq 当前处理数量 private static final Gauge mqBusinessCurrentSize = Gauge.build() .name("mq_process_current_gauge") .labelNames("msgType") .help("rabbitmq receiver completed time in milliseconds") .register(); 当前仍在处理消息的进程数量 Metrices: mq_process_current_gauge{pod_name=~"$pod"} Legend: MQ 平均业务处理时间 / 1m Metrices: max(rate(mq_business_process_time_milliseconds_sum{status="success",k8s_cluster=~"sm|sj02|ali-bj|ali-sh",msgType!~"4.*"}[2m]) /rate(mq_business_process_time_milliseconds_count{status="success",k8s_cluster=~"sm|sj02|ali-bj|ali-sh",msgType!~"4.*"}[2m])) by (k8s_cluster,msgType) Legend: ================================================================================================================================ Metrices: sum(mq_process_current_gauge{pod_name=~"$pod", msgType=~"1.*|2.*"} > 0) by (msgType) Legend: {{msgType}} redis 处理时间统计 private static final Summary redisProcessTimeInMs = Summary.build() .name("redis_process_time_milliseconds") .labelNames("method", "status") .help("redis process completed time in milliseconds") .register(); Redis 耗时分布 / 1m Metrices: rate(redis_process_time_milliseconds_sum{pod_name=~"$pod"}[5m]) / (rate(redis_process_time_milliseconds_count{pod_name=~"$pod"}[5m]) > 0) or rate(redis_process_time_milliseconds_count{pod_name=~"$pod"}[5m]) > bool 0 Legend: Redis 平均响应耗时 Metrices: topk(5,sum (rate(redis_process_time_milliseconds_sum{pod_name=~"$pod"}[5m]) / (rate(redis_process_time_milliseconds_count{pod_name=~"$pod"}[5m]) > 0) or rate(redis_process_time_milliseconds_count{pod_name=~"$pod"}[5m]) > bool 0) by (method)) Legend: {{method}} Metrices: avg (rate(redis_process_time_milliseconds_sum{k8s_cluster=~"sm|sj02|ali-bj|ali-sh", status="success"}[2m]) / (rate(redis_process_time_milliseconds_count{k8s_cluster=~"sm|sj02|ali-bj|ali-sh", status="success"}[2m])) ) by (method,k8s_cluster) Legend: [{{k8s_cluster}}]-{{method}}
PrometheusInterceptor.java


import io.prometheus.client.Histogram;
import org.springframework.web.servlet.handler.HandlerInterceptorAdapter;

import javax.servlet.http.HttpServletRequest;
import javax.servlet.http.HttpServletResponse;

public class PrometheusInterceptor extends HandlerInterceptorAdapter {

    private ThreadLocal<Histogram.Timer> timerThreadLocal = new ThreadLocal<>();

    @Override
    public boolean preHandle(HttpServletRequest request, HttpServletResponse response, Object handler) throws Exception {
        // 正在处理的请求量
        MetricsExporter.getDuringReqGauge().labels(request.getRequestURI(), request.getMethod()).dec();

        timerThreadLocal.set(MetricsExporter.getReqLatencyHistogram()
                .labels(request.getRequestURI(), request.getMethod(), String.valueOf(response.getStatus()))
                .startTimer());
        return super.preHandle(request, response, handler);
    }

    @Override
    public void afterCompletion(HttpServletRequest request, HttpServletResponse response, Object handler, Exception ex) throws Exception {
        String uri = request.getRequestURI();
        String method = request.getMethod();
        int status = response.getStatus();
        // count 请求计数,标签分别为 请求路径,请求方法,response http code
        // 请求应用总量:  sum(demo_rest_req_total)
        // 每秒http请求量: sum(rate(demo_rest_req_total[1m])
        // 请求topk的url:  topk(10, sum(demo_rest_req_total) by (path))
        MetricsExporter.getReqCounter().labels(uri, method, String.valueOf(status)).inc();

        // 请求完毕,计数器-1
        MetricsExporter.getDuringReqGauge().labels(uri, method).dec();

        // 直方图统计
        Histogram.Timer timer = timerThreadLocal.get();
        if (timer != null) {
            timer.observeDuration();
            timerThreadLocal.remove();
        }
        super.afterCompletion(request, response, handler, ex);
    }
}
配置拦截器,这里也可以使用AOP

@Slf4j
@SpringBootApplication(scanBasePackages = {"com.xx.xx.evaluate"})
public class EvaluateApplication implements WebMvcConfigurer {
    @Override
    public void addInterceptors(InterceptorRegistry registry) {
        registry.addInterceptor(new PrometheusInterceptor()).addPathPatterns("/**");
    }
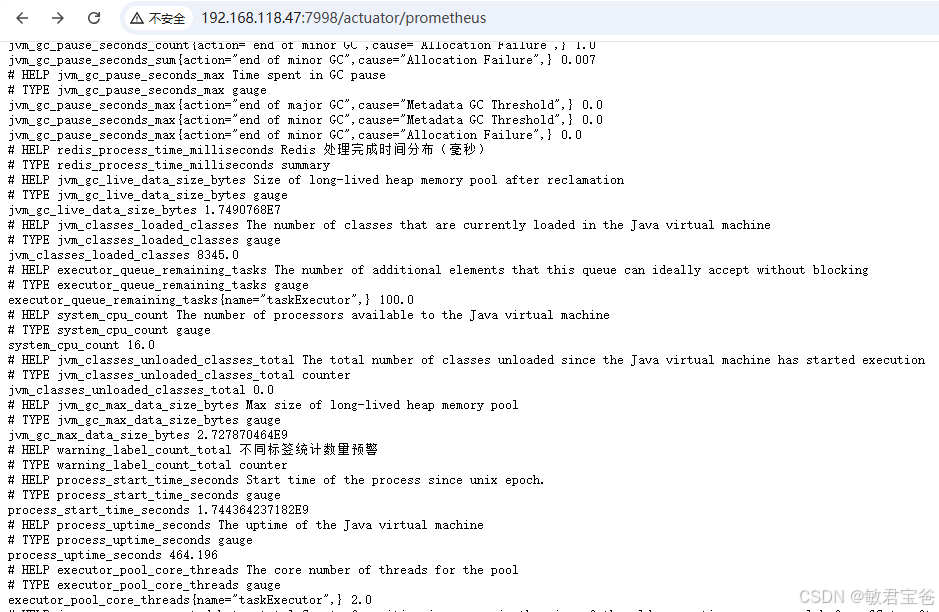
http://192.168.118.47:7998/actuator/prometheus
management:
  endpoint:
    metrics:
      enabled: true
    prometheus:
      enabled: true
  endpoints:
    web:
      exposure:
        include: "*"
  metrics:
    tags:
      application: app-name
scrape_configs:
- job_name: 'prometheus'
metrics_path: /actuator/prometheus
static_configs:
- targets: ['192.168.118.47:7998']
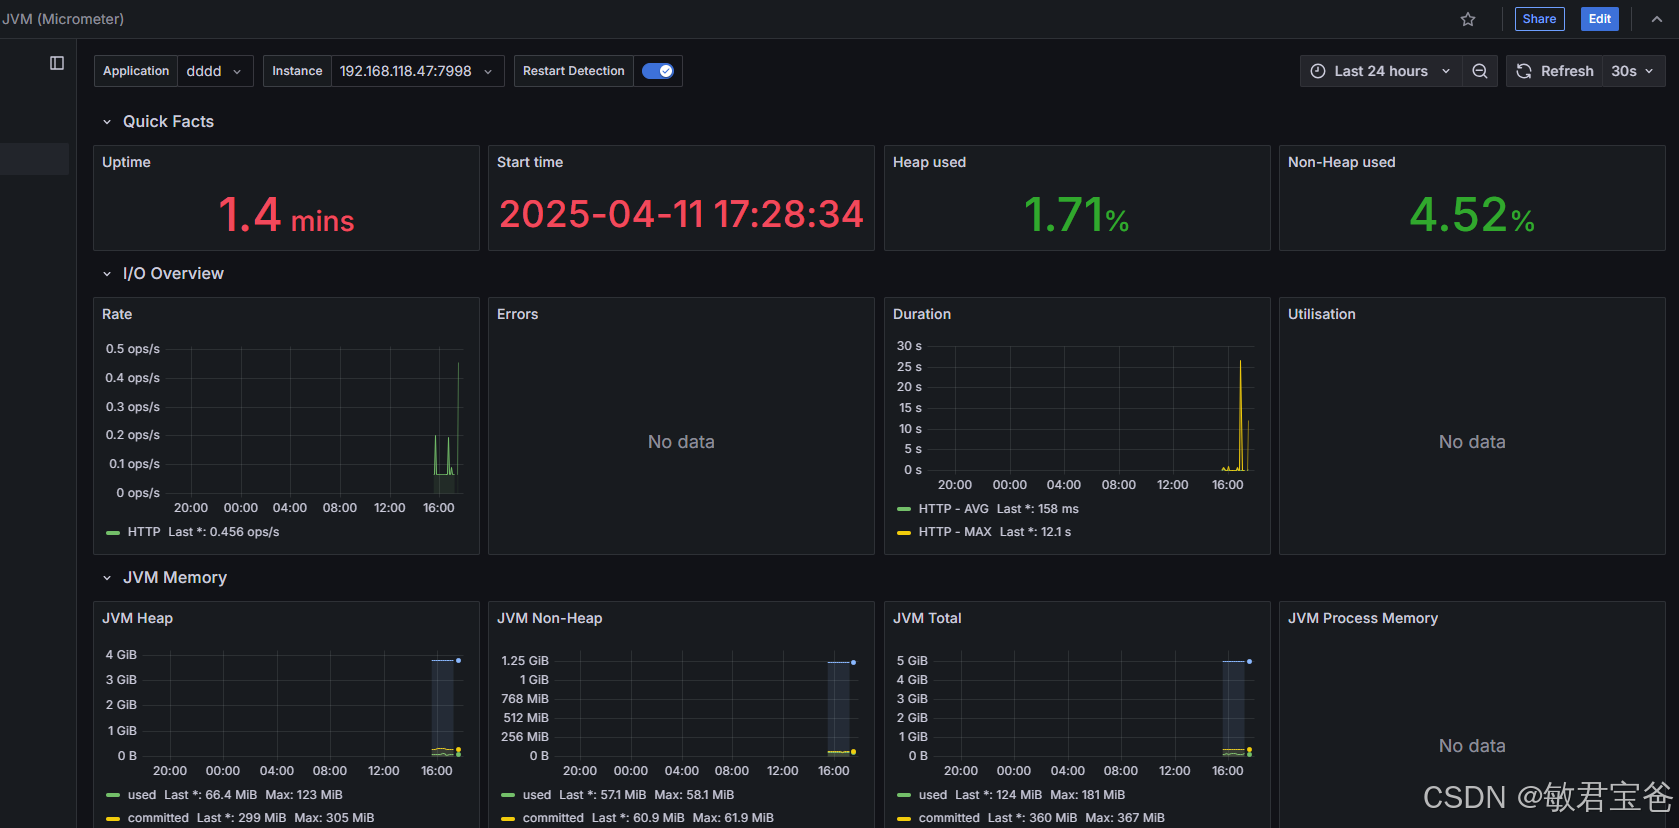
https://grafana.com/grafana/dashboards/14430
4701
11157 Druid Connection Pool Dashboard
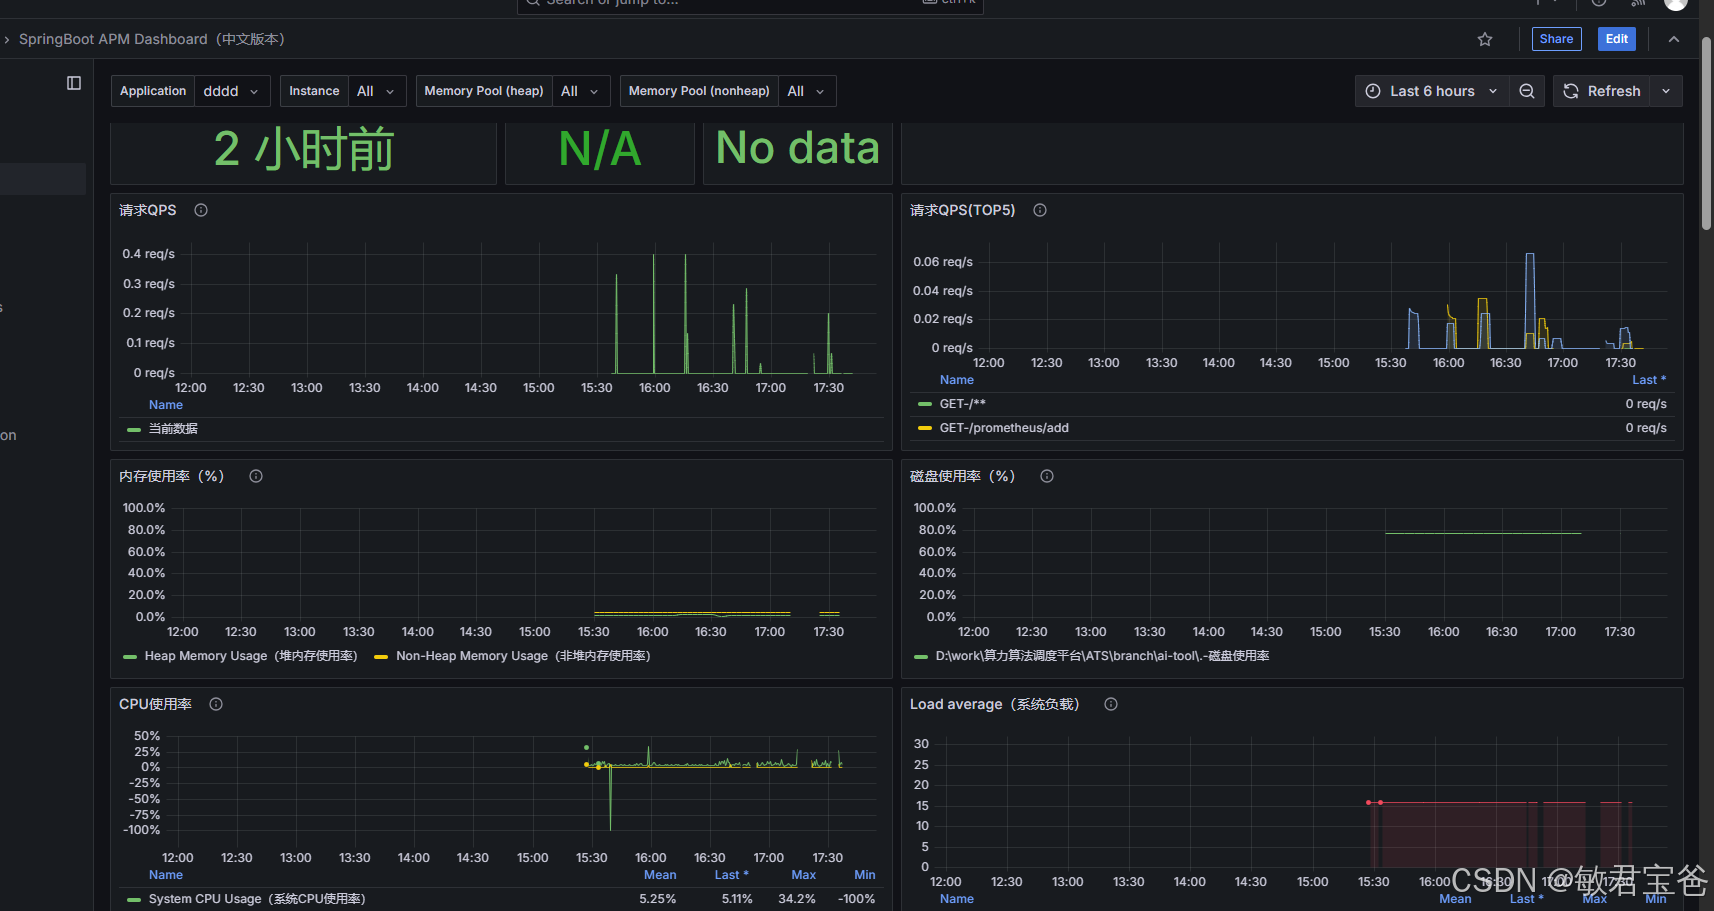
12464、14430、21319 Spring Boot Statistics & Endpoint Metrics
方式二:基于micrometer实现自定义指标

package com.sdses.aems.evaluate.config.prometheus;

import io.micrometer.core.instrument.MeterRegistry;
import io.micrometer.core.instrument.Tags;
import io.micrometer.core.instrument.Timer;
import org.springframework.beans.factory.annotation.Autowired;
import org.springframework.web.servlet.AsyncHandlerInterceptor;
import org.springframework.web.servlet.ModelAndView;

import javax.servlet.http.HttpServletRequest;
import javax.servlet.http.HttpServletResponse;

public class MetricInterceptor implements AsyncHandlerInterceptor {

    @Autowired
    private MeterRegistry meterRegistry;

    private final ThreadLocal<Timer.Sample> threadLocal = new ThreadLocal<>();

    @Override
    public boolean preHandle(HttpServletRequest request, HttpServletResponse response, Object handler) throws Exception {
        try {
            // 总计数 + 1
            meterRegistry.counter("micro_req_total", Tags.of("url", request.getRequestURI(), "method", request.getMethod())).increment();

            // 记录进入的请求数量
            meterRegistry.counter("micro_process_req_enter", Tags.of("url", request.getRequestURI(), "method", request.getMethod())).increment();

            // 启动 Timer.Sample
            Timer.Sample sample = Timer.start(meterRegistry);
            threadLocal.set(sample);
        } catch (Exception e) {
            threadLocal.remove(); // 清理 ThreadLocal
            throw e;
        }
        return true;
    }

    @Override
    public void postHandle(HttpServletRequest request, HttpServletResponse response, Object handler, ModelAndView modelAndView) throws Exception {
        try {
            // 记录离开的请求数量
            meterRegistry.counter("micro_process_req_exit", Tags.of("url", request.getRequestURI(), "method", request.getMethod())).increment();

            Timer.Sample sample = threadLocal.get();
            if (sample != null) {
                Timer timer = meterRegistry.timer("micro_req_histogram",
                        "url", request.getRequestURI(),
                        "method", request.getMethod(),
                        "code", String.valueOf(response.getStatus()));
                sample.stop(timer);
            }
        } finally {
            threadLocal.remove(); // 确保清理 ThreadLocal
        }
    }
}


   @Override
    public void addInterceptors(InterceptorRegistry registry) {
        registry.addInterceptor(new PrometheusInterceptor()).addPathPatterns("/**");
        registry.addInterceptor(metricInterceptor()).addPathPatterns("/**");
    }

    @Bean
    public MetricInterceptor metricInterceptor() {
        return new MetricInterceptor();
    }