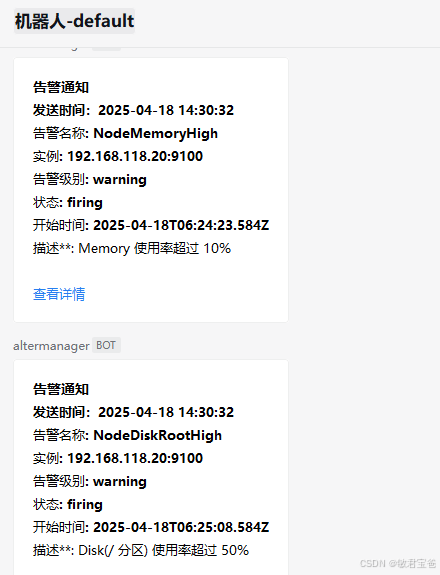
java接受告警请求 @RestController @RequestMapping("/alert") @Slf4j public class TestApi { private static final DateTimeFormatter FORMATTER = DateTimeFormatter.ofPattern("yyyy-MM-dd HH:mm:ss"); @RequestMapping public void sendTemplate(HttpServletRequest request) throws Exception { String requestBody = StreamUtils.copyToString(request.getInputStream(), StandardCharsets.UTF_8); JSONObject jsonObject = JSONUtil.parseObj(requestBody); log.info("sendTemplate {}", jsonObject); // 遍历告警信息 JSONArray alerts = jsonObject.getJSONArray("alerts"); for (int i = 0; i < alerts.size(); i++) { JSONObject alert = alerts.getJSONObject(i); JSONObject labels = alert.getJSONObject("labels"); JSONObject annotations = alert.getJSONObject("annotations"); // 替换模板中的占位符 Map<String, Object> templateData = new HashMap<>(); templateData.put("sendTime", LocalDateTime.now().format(FORMATTER)); templateData.put("alertname", labels.getStr("alertname")); templateData.put("instance", labels.getStr("instance")); templateData.put("severity", labels.getStr("severity")); templateData.put("status", alert.getStr("status")); templateData.put("startsAt", alert.getStr("startsAt")); templateData.put("description", annotations.getStr("description")); templateData.put("generatorURL", alert.getStr("generatorURL")); String alertMsg = TemplateUtils.renderTemplate("alert.ftl", templateData); // 调用企业微信机器人发送消息 WeComBot.sendToWeComBot(alertMsg); } } }
       <!-- FreeMarker Template Engine -->
        <dependency>
            <groupId>org.springframework.boot</groupId>
            <artifactId>spring-boot-starter-freemarker</artifactId>
        </dependency>


import freemarker.template.Configuration;
import freemarker.template.Template;

import java.io.StringWriter;
import java.util.Map;

public class TemplateUtils {

    private static final Configuration freemarkerConfig;

    // 静态初始化 FreeMarker 配置
    static {
        freemarkerConfig = new Configuration(Configuration.VERSION_2_3_31);
        freemarkerConfig.setClassForTemplateLoading(TemplateUtils.class, "/templates");
        freemarkerConfig.setDefaultEncoding("UTF-8");
    }

    /**
     * 使用 FreeMarker 渲染模板
     *
     * @param templateName 模板文件名(如 "alert.ftl")
     * @param data         数据模型(键值对)
     * @return 渲染后的字符串
     */
    public static String renderTemplate(String templateName, Map<String, Object> data) {
        try {
            // 加载模板
            Template template = freemarkerConfig.getTemplate(templateName);

            // 渲染模板
            StringWriter writer = new StringWriter();
            template.process(data, writer);

            return writer.toString();
        } catch (Exception e) {
            throw new RuntimeException("模板渲染失败", e);
        }
    }
}


public class WeComBot {

    private static final String WEBHOOK_URL = "https://qyapi.weixin.qq.com/cgi-binbbfc-4412c60ad031";

    /**
     * 发送消息到企业微信机器人
     *
     * @param message 消息内容
     * @throws Exception 如果发送失败
     */
    public static void sendToWeComBot(String message) throws Exception {
        // 构造 JSON 数据
        String jsonPayload = JSONUtil.createObj()
                .put("msgtype", "markdown")
                .put("markdown", JSONUtil.createObj().put("content", message))
                .toString();

        // 发送 HTTP POST 请求
        HttpResponse response = HttpRequest.post(WEBHOOK_URL)
                .header("Content-Type", "application/json; utf-8") // 设置请求头
                .body(jsonPayload) // 设置请求体
                .timeout(5000) // 设置超时时间为 5 秒(单位:毫秒)
                .execute(); // 执行请求

        // 检查响应状态码
        if (response.getStatus() != 200) {
            throw new RuntimeException("Failed to send message: HTTP error code " + response.getStatus());
        }
    }
}
alertmanager:
image: prom/alertmanager:v0.26.0
environment:
- TZ=Asia/Shanghai
container_name: alertmanager
volumes:
- ./alertmanager.yml:/etc/alertmanager/alertmanager.yml
- ./alertmanager/templates:/etc/alertmanager/templates
- ./alertmanager/data:/alertmanager
command:
- "--config.file=/etc/alertmanager/alertmanager.yml"
- "--storage.path=/alertmanager"
- "--log.level=info" # 设置日志级别(可选)
ports:
- "9093:9093"
- "9094:9094"
restart: always
docker-prometheus.yaml

version: '3.8'

services:
  prometheus:
    image: bitnami/prometheus:3.0.0
    container_name: prometheus
    hostname: prometheus
    ports:
      - "9090:9090" # Prometheus Web UI 端口
    volumes:
      - ./prometheus.yml:/etc/prometheus/prometheus.yml
      - ./prometheus-data:/prometheus
      - ./rules:/rules
    command:
      - '--config.file=/etc/prometheus/prometheus.yml'
      - '--web.external-url=http://192.168.118.20:9090/'
      - '--web.enable-lifecycle'
      - '--storage.tsdb.retention.time=90d'
      - "--storage.tsdb.path=/prometheus"
      - "--web.enable-admin-api"
    restart: always

  alertmanager:
    image: prom/alertmanager:v0.26.0
    environment:
      - TZ=Asia/Shanghai
    container_name: alertmanager
    volumes:
      - ./alertmanager.yml:/etc/alertmanager/alertmanager.yml
      - ./alertmanager/templates:/etc/alertmanager/templates
      - ./alertmanager/data:/alertmanager
    command:
      - "--config.file=/etc/alertmanager/alertmanager.yml"
      - "--storage.path=/alertmanager"
      - "--log.level=info"             # 设置日志级别(可选)
    ports:
      - "9093:9093"
      - "9094:9094"
    restart: always


  grafana:
    image: grafana/grafana:11.3.3
    container_name: grafana
    hostname: grafana
    ports:
      - "3000:3000" # Grafana Web UI 端口
    environment:
      GF_SECURITY_ADMIN_PASSWORD: admin # 设置 Grafana 的管理员密码
    volumes:
      - ./grafana-storage:/var/lib/grafana
    restart: always
  node-exporter:
    image: bitnami/node-exporter:1.8.1
    container_name: node-exporter
    restart: unless-stopped
    ports:
      - "9100:9100"
    volumes:
      - /proc:/host/proc:ro
      - /sys:/host/sys:ro
      - /:/rootfs:ro
    environment:
      IGNORE_MOUNT_POINTS: "^/(sys|proc|dev|host|etc)($$|/)"
      IGNORE_FS_TYPES: "^(sys|proc|auto)fs$$"
    command:
      - '--path.procfs=/host/proc'
      - '--path.sysfs=/host/sys'
      - '--path.rootfs=/rootfs'  # 修复了未闭合的引号
      - '--collector.filesystem.ignored-mount-points=${IGNORE_MOUNT_POINTS}'
      - '--collector.filesystem.ignored-fs-types=${IGNORE_FS_TYPES}'  # 修复了无效的 #{}
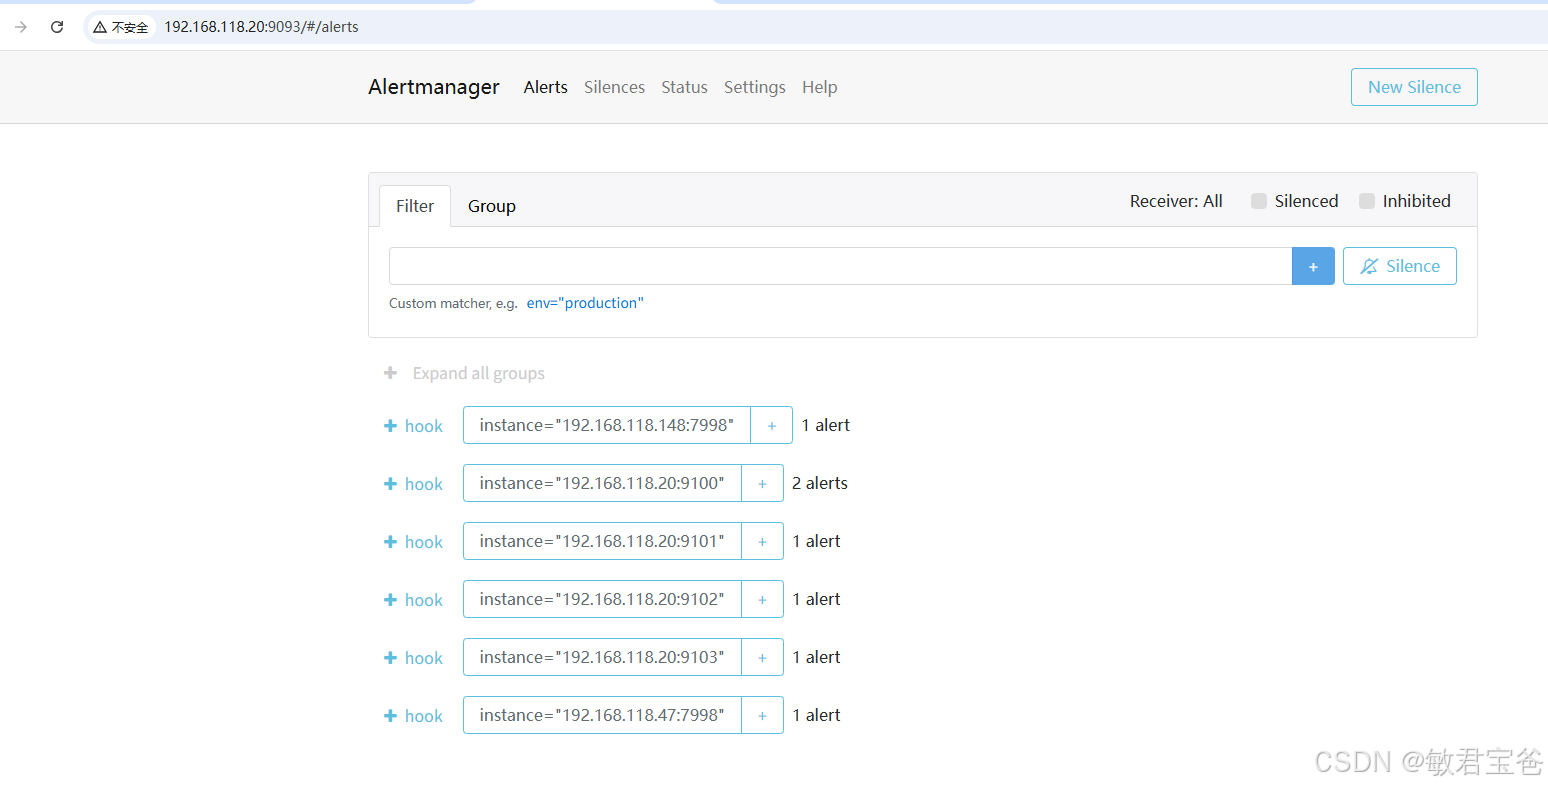
alertmanager.yml


global:
  resolve_timeout: 5m #表示如果告警在 5 分钟内没有被解决,则认为该告警已恢复


route:
  receiver: 'default'
  group_by: ['instance'] #通过alertname(告警名称)的值对告警进行分类 ;按照实例(instance)对告警进行分组
  group_wait: 10s  #表示第一次触发告警时会等待 10 秒后再发送通
  group_interval: 20s #表示两次告警之间的最小间隔为 20 秒; 同一组内两次告警之间的最小间隔为 20 秒
  repeat_interval: 1m #如果告警持续存在,每隔 1 分钟重复发送一次通知

  routes:
  - receiver: "hook"  #webhook通知
    group_wait: 10s
    #match:
     # service: "test"
      #severity: "critical"
   # match_re:
   #   service: "pods|critical"
   #   severity: "warning"
   # matchers:
   #   - service =~ "test|pods|critical"
   #   - severity =~ "critical|warning"

  - receiver: "hook1"  #邮件通知
    group_wait: 25s
    #matchers:
     # - severity =~ "critical|warning|info"


receivers:
- name: 'hook'
  webhook_configs:
  - url: 'http://192.168.118.47:7998/alert'

- name: "hook1"
  webhook_configs:
  - url: 'https://xe88-864e-8a9e7c476a18'
    send_resolved: true #通知已经恢复的告警

- name: "default"
  webhook_configs:
  - url: 'https://x4af1-bbfc-4412c60ad031'
    send_resolved: true #通知已经恢复的告警

- name: 'wechat'
  webhook_configs:
  - url: 'https://x-bbfc-4412c60ad031'
    send_resolved: true


inhibit_rules: #抑制的规则
- source_match:
    severity: 'critical'
  target_match:
    severity: 'warning'
  equal: ['alertname', 'dev', 'instance']
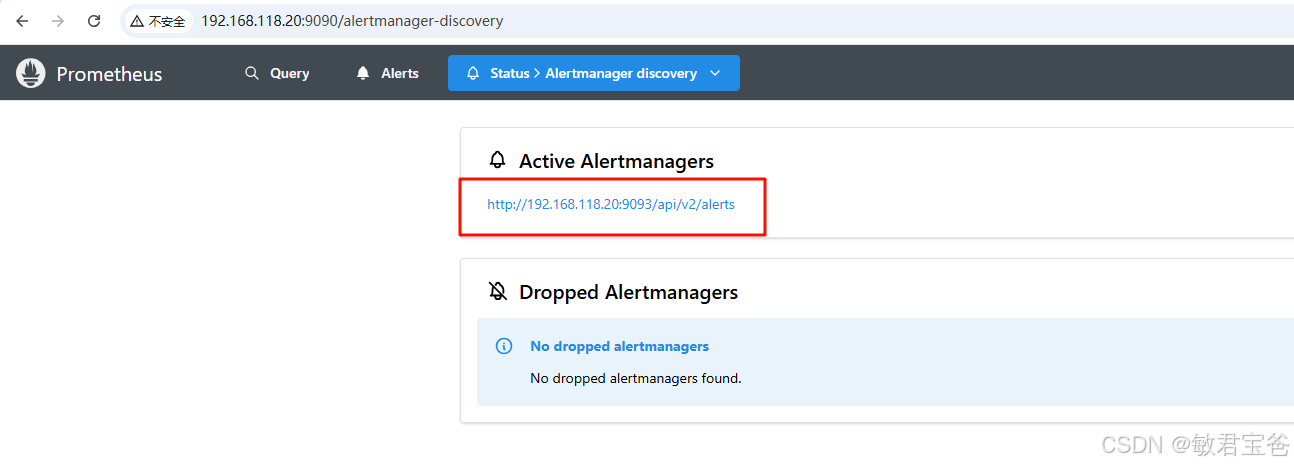
alerting:
alertmanagers:
- static_configs:
- targets:
- 192.168.118.20:9093
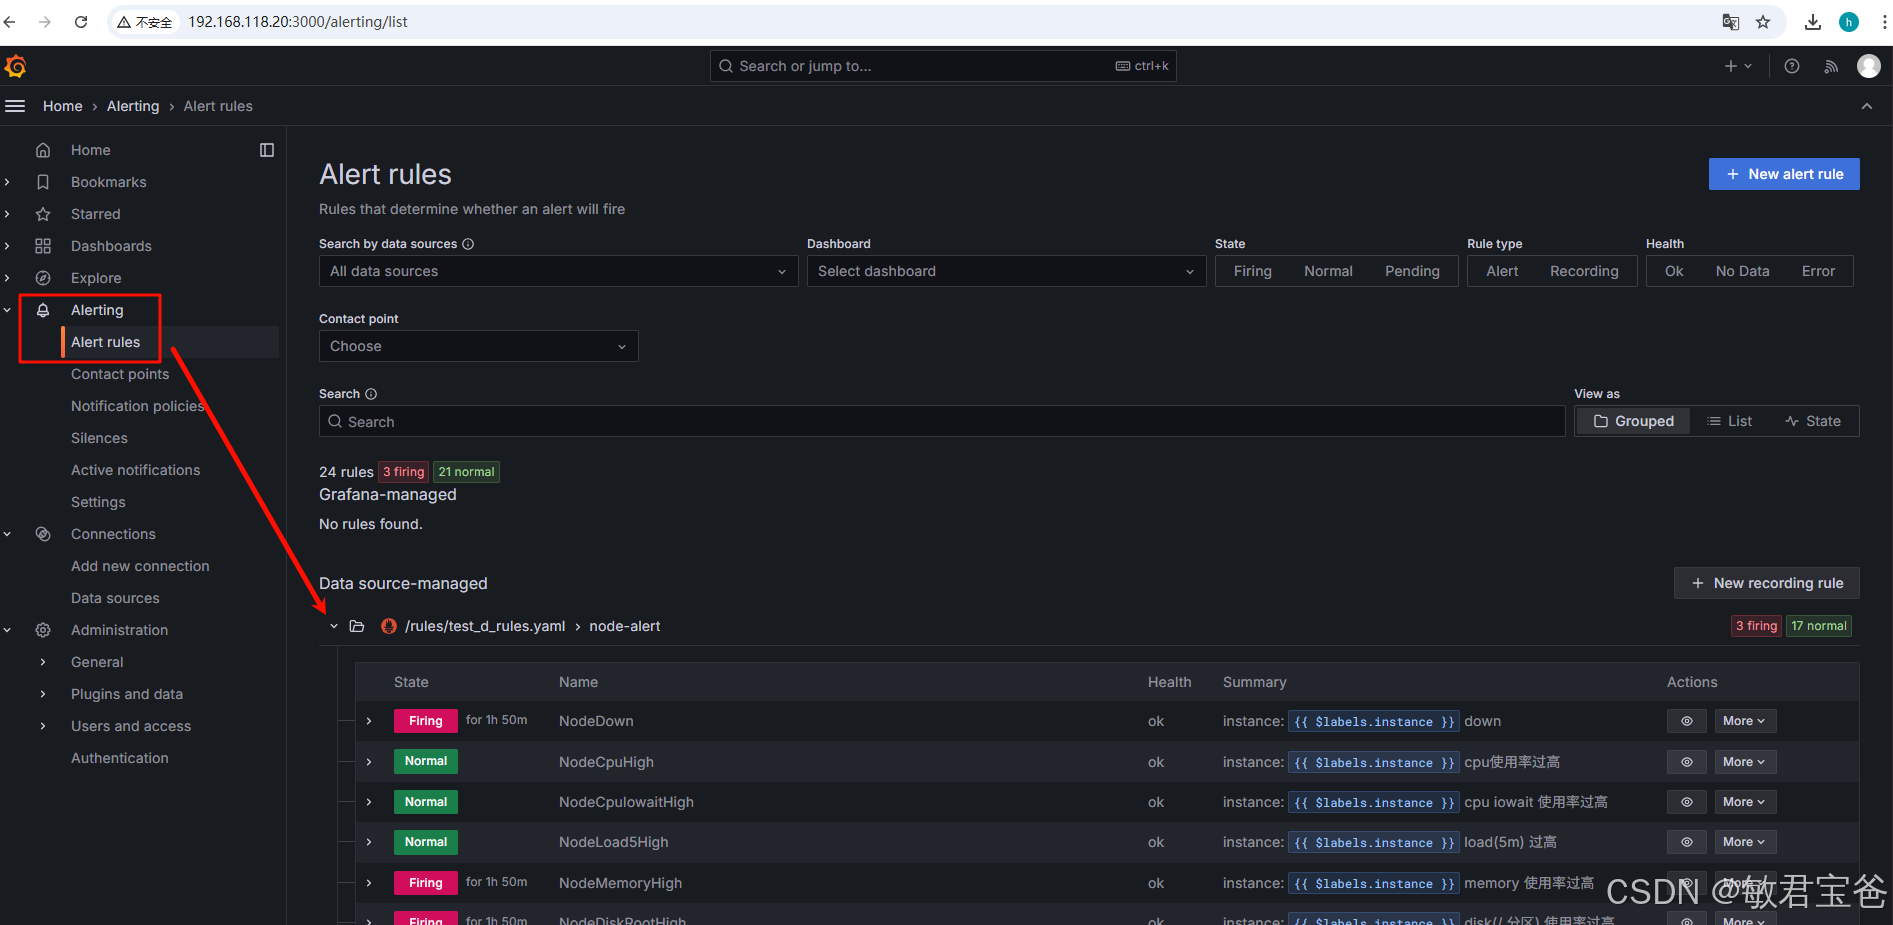
rule_files:
- "/rules/*_rules.yaml"
prometheus.yml


global:
  scrape_interval: 15s # Set the scrape interval to every 15 seconds. Default is every 1 minute.
  evaluation_interval: 15s # Evaluate rules every 15 seconds. The default is every 1 minute.
  # scrape_timeout is set to the global default (10s).

# Alertmanager configuration
alerting:
  alertmanagers:
    - static_configs:
        - targets:
            - 192.168.118.20:9093


rule_files:
  - "/rules/*_rules.yaml"

scrape_configs:
  - job_name: 'kafka'
    static_configs:
      - targets:
          - '192.168.118.20:9101' # 对应 kafka1 的 JMX Exporter 端口
          - '192.168.118.20:9102' # 对应 kafka2 的 JMX Exporter 端口
          - '192.168.118.20:9103' # 对应 kafka3 的 JMX Exporter 端口

  - job_name: "node"
    static_configs:
      - targets: ["192.168.118.20:9100"]

  - job_name: 'prometheus'
    metrics_path: /actuator/prometheus
    static_configs:
      - targets: ['192.168.118.47:7998']
  - job_name: 'prometheus1'
    metrics_path: /actuator/prometheus
    static_configs:
      - targets: ['192.168.118.148:7998']
customer_rules.yaml

groups:
  - name: node-alert
    rules:
    - alert: NodeDown
      expr: up == 0
      for: 5m
      labels:
        severity: critical
        instance: "{{ $labels.instance }}"
      annotations:
        summary: "instance: {{ $labels.instance }} down"
        description: "Instance: {{ $labels.instance }} 已经宕机 5分钟"
        value: "{{ $value }}"

    - alert: NodeCpuHigh
      expr: (1 - avg by (instance) (irate(node_cpu_seconds_total{mode="idle"}[5m]))) * 100 > 10
      for: 10s
      labels:
        severity: warning
        instance: "{{ $labels.instance }}"
      annotations:
        summary: "instance: {{ $labels.instance }} cpu使用率过高"
        description: "CPU 使用率超过 80%"
        value: "{{ $value }}"

    - alert: NodeCpuIowaitHigh
      expr: avg by (instance) (irate(node_cpu_seconds_total{mode="iowait"}[5m])) * 100 > 80
      for: 5m
      labels:
        severity: warning
        instance: "{{ $labels.instance }}"
      annotations:
        summary: "instance: {{ $labels.instance }} cpu iowait 使用率过高"
        description: "CPU iowait 使用率超过 50%"
        value: "{{ $value }}"

    - alert: NodeLoad5High
      expr: node_load5 > (count by (instance) (node_cpu_seconds_total{mode='system'})) * 1.2
      for: 5m
      labels:
        severity: warning
        instance: "{{ $labels.instance }}"
      annotations:
        summary: "instance: {{ $labels.instance }} load(5m) 过高"
        description: "Load(5m) 过高,超出cpu核数 1.2倍"
        value: "{{ $value }}"

    - alert: NodeMemoryHigh
      expr: (1 - node_memory_MemAvailable_bytes / node_memory_MemTotal_bytes) * 100 > 10
      for: 10s
      labels:
        severity: warning
        instance: "{{ $labels.instance }}"
      annotations:
        summary: "instance: {{ $labels.instance }} memory 使用率过高"
        description: "Memory 使用率超过 10%"
        value: "{{ $value }}"

    - alert: NodeDiskRootHigh
      expr: (1 - node_filesystem_avail_bytes{fstype=~"ext.*|xfs",mountpoint ="/"} / node_filesystem_size_bytes{fstype=~"ext.*|xfs",mountpoint ="/"}) * 100 > 50
      for: 1m
      labels:
        severity: warning
        instance: "{{ $labels.instance }}"
      annotations:
        summary: "instance: {{ $labels.instance }} disk(/ 分区) 使用率过高"
        description: "Disk(/ 分区) 使用率超过 50%"
        value: "{{ $value }}"

    - alert: NodeDiskBootHigh
      expr: (1 - node_filesystem_avail_bytes{fstype=~"ext.*|xfs",mountpoint ="/boot"} / node_filesystem_size_bytes{fstype=~"ext.*|xfs",mountpoint ="/boot"}) * 100 > 50
      for: 10s
      labels:
        severity: warning
        instance: "{{ $labels.instance }}"
      annotations:
        summary: "instance: {{ $labels.instance }} disk(/boot 分区) 使用率过高"
        description: "Disk(/boot 分区) 使用率超过 50%"
        value: "{{ $value }}"

    - alert: NodeDiskReadHigh
      expr: irate(node_disk_read_bytes_total[5m]) > 20 * (1024 ^ 2)
      for: 5m
      labels:
        severity: warning
        instance: "{{ $labels.instance }}"
      annotations:
        summary: "instance: {{ $labels.instance }} disk 读取字节数 速率过高"
        description: "Disk 读取字节数 速率超过 20 MB/s"
        value: "{{ $value }}"

    - alert: NodeDiskWriteHigh
      expr: irate(node_disk_written_bytes_total[5m]) > 20 * (1024 ^ 2)
      for: 5m
      labels:
        severity: warning
        instance: "{{ $labels.instance }}"
      annotations:
        summary: "instance: {{ $labels.instance }} disk 写入字节数 速率过高"
        description: "Disk 写入字节数 速率超过 20 MB/s"
        value: "{{ $value }}"

    - alert: NodeDiskReadRateCountHigh
      expr: irate(node_disk_reads_completed_total[5m]) > 3000
      for: 5m
      labels:
        severity: warning
        instance: "{{ $labels.instance }}"
      annotations:
        summary: "instance: {{ $labels.instance }} disk iops 每秒读取速率过高"
        description: "Disk iops 每秒读取速率超过 3000 iops"
        value: "{{ $value }}"

    - alert: NodeDiskWriteRateCountHigh
      expr: irate(node_disk_writes_completed_total[5m]) > 3000
      for: 5m
      labels:
        severity: warning
        instance: "{{ $labels.instance }}"
      annotations:
        summary: "instance: {{ $labels.instance }} disk iops 每秒写入速率过高"
        description: "Disk iops 每秒写入速率超过 3000 iops"
        value: "{{ $value }}"

    - alert: NodeInodeRootUsedPercentHigh
      expr: (1 - node_filesystem_files_free{fstype=~"ext4|xfs",mountpoint="/"} / node_filesystem_files{fstype=~"ext4|xfs",mountpoint="/"}) * 100 > 80
      for: 10m
      labels:
        severity: warning
        instance: "{{ $labels.instance }}"
      annotations:
        summary: "instance: {{ $labels.instance }} disk(/ 分区) inode 使用率过高"
        description: "Disk (/ 分区) inode 使用率超过 80%"
        value: "{{ $value }}"

    - alert: NodeInodeBootUsedPercentHigh
      expr: (1 - node_filesystem_files_free{fstype=~"ext4|xfs",mountpoint="/boot"} / node_filesystem_files{fstype=~"ext4|xfs",mountpoint="/boot"}) * 100 > 80
      for: 10m
      labels:
        severity: warning
        instance: "{{ $labels.instance }}"
      annotations:
        summary: "instance: {{ $labels.instance }} disk(/boot 分区) inode 使用率过高"
        description: "Disk (/boot 分区) inode 使用率超过 80%"
        value: "{{ $value }}"

    - alert: NodeFilefdAllocatedPercentHigh
      expr: node_filefd_allocated / node_filefd_maximum * 100 > 80
      for: 10m
      labels:
        severity: warning
        instance: "{{ $labels.instance }}"
      annotations:
        summary: "instance: {{ $labels.instance }} filefd 打开百分比过高"
        description: "Filefd 打开百分比 超过 80%"
        value: "{{ $value }}"

    - alert: NodeNetworkNetinBitRateHigh
      expr: avg by (instance) (irate(node_network_receive_bytes_total{device=~"eth0|eth1|ens33|ens37"}[1m]) * 8) > 20 * (1024 ^ 2) * 8
      for: 3m
      labels:
        severity: warning
        instance: "{{ $labels.instance }}"
      annotations:
        summary: "instance: {{ $labels.instance }} network 接收比特数 速率过高"
        description: "Network 接收比特数 速率超过 20MB/s"
        value: "{{ $value }}"

    - alert: NodeNetworkNetoutBitRateHigh
      expr: avg by (instance) (irate(node_network_transmit_bytes_total{device=~"eth0|eth1|ens33|ens37"}[1m]) * 8) > 20 * (1024 ^ 2) * 8
      for: 3m
      labels:
        severity: warning
        instance: "{{ $labels.instance }}"
      annotations:
        summary: "instance: {{ $labels.instance }} network 发送比特数 速率过高"
        description: "Network 发送比特数 速率超过 20MB/s"
        value: "{{ $value }}"

    - alert: NodeNetworkNetinPacketErrorRateHigh
      expr: avg by (instance) (irate(node_network_receive_errs_total{device=~"eth0|eth1|ens33|ens37"}[1m])) > 15
      for: 3m
      labels:
        severity: warning
        instance: "{{ $labels.instance }}"
      annotations:
        summary: "instance: {{ $labels.instance }} 接收错误包 速率过高"
        description: "Network 接收错误包 速率超过 15个/秒"
        value: "{{ $value }}"

    - alert: NodeNetworkNetoutPacketErrorRateHigh
      expr: avg by (instance) (irate(node_network_transmit_packets_total{device=~"eth0|eth1|ens33|ens37"}[1m])) > 15
      for: 3m
      labels:
        severity: warning
        instance: "{{ $labels.instance }}"
      annotations:
        summary: "instance: {{ $labels.instance }} 发送错误包 速率过高"
        description: "Network 发送错误包 速率超过 15个/秒"
        value: "{{ $value }}"

    - alert: NodeProcessBlockedHigh
      expr: node_procs_blocked{job="node"} > 10
      for: 10m
      labels:
        severity: warning
        instance: "{{ $labels.instance }}"
      annotations:
        summary: "instance: {{ $labels.instance }} 当前被阻塞的任务的数量过多"
        description: "Process 当前被阻塞的任务的数量超过 10个"
        value: "{{ $value }}"

    - alert: NodeTimeOffsetHigh
      expr: abs(node_timex_offset_seconds{job="node"}) > 3 * 60
      for: 2m
      labels:
        severity: info
        instance: "{{ $labels.instance }}"
      annotations:
        summary: "instance: {{ $labels.instance }} 时间偏差过大"
        description: "Time 节点的时间偏差超过 3m"
        value: "{{ $value }}"

https://segmentfault.com/a/1190000043690204
prometheus结合consul+confd实现动态注册服务和动态更新配置告警规则_prometheus confd-CSDN博客
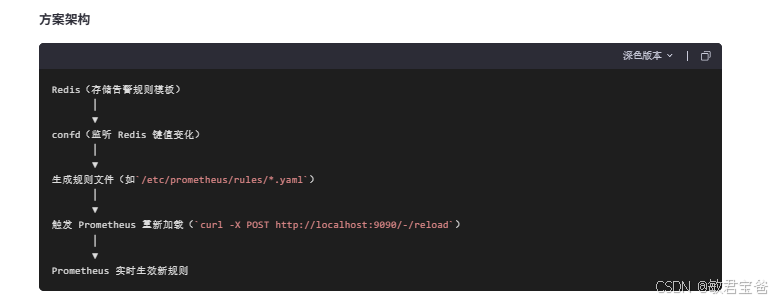
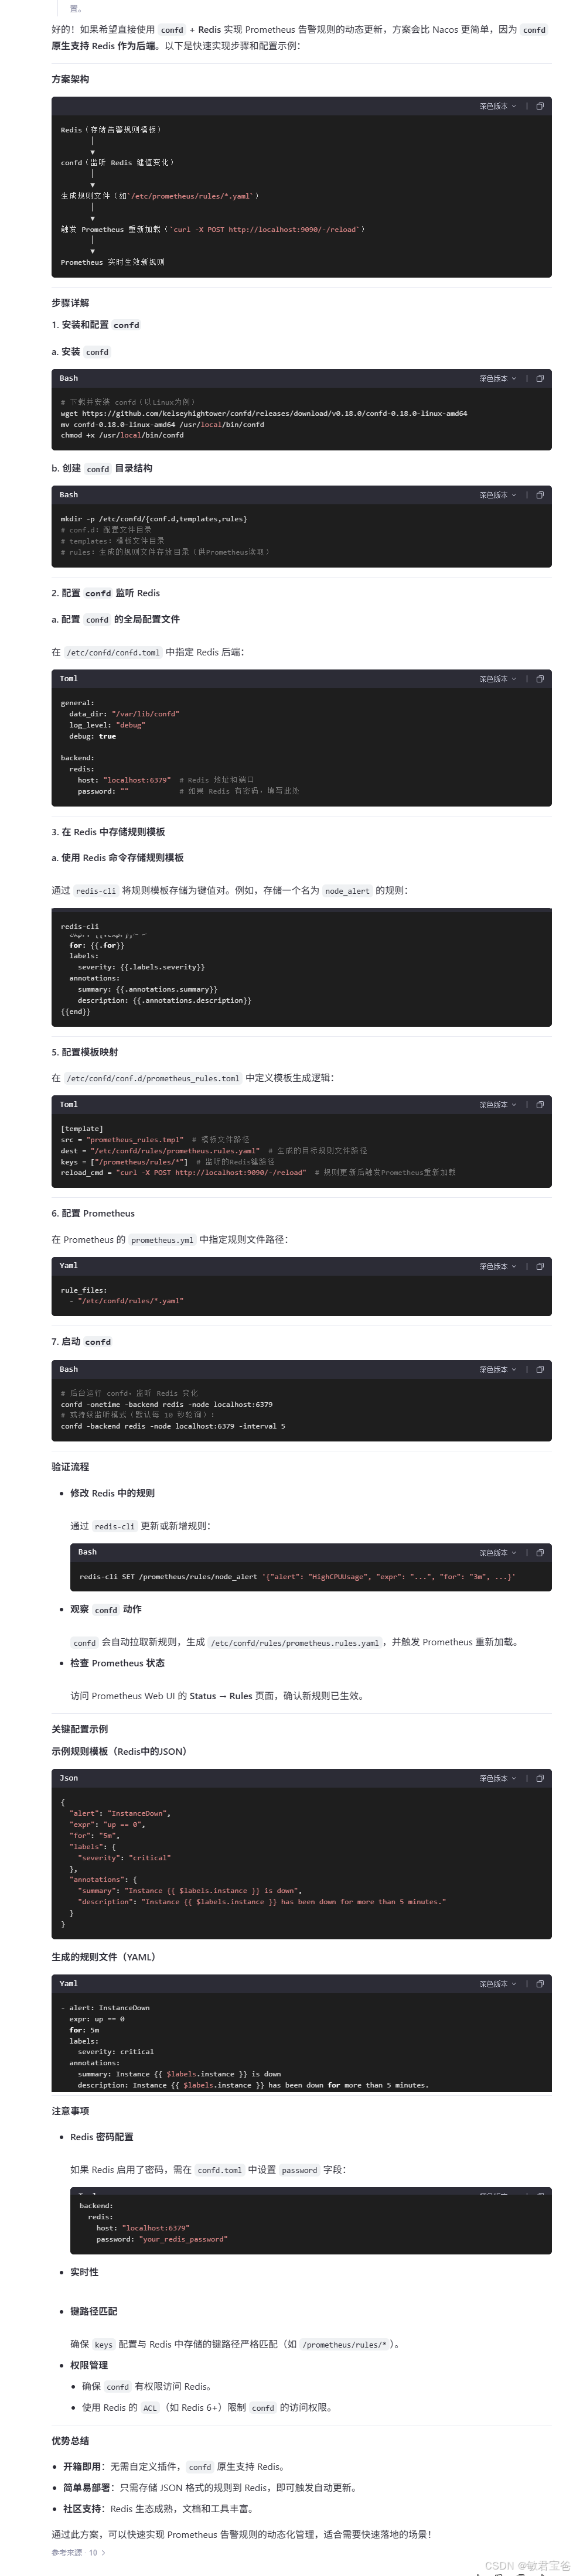
如若想动态修改下面规则内容; 可采用以下方案;
rule_files:
# - "first_rules.yml"
# - "second_rules.yml"
- "/rules/*_rules.yaml"
# Download the binary
wget https://github.com/kelseyhightower/confd/releases/download/v0.16.0/confd-0.16.0-linux-amd64
# 重命名二进制文件,并移动到PATH的目录下
mv confd-0.16.0-linux-amd64 /usr/local/bin/confd
chmod +x /usr/local/bin/confd
# 验证是否安装成功
confd --helpsudo mkdir -p /etc/confd/{conf.d,templates,rules}