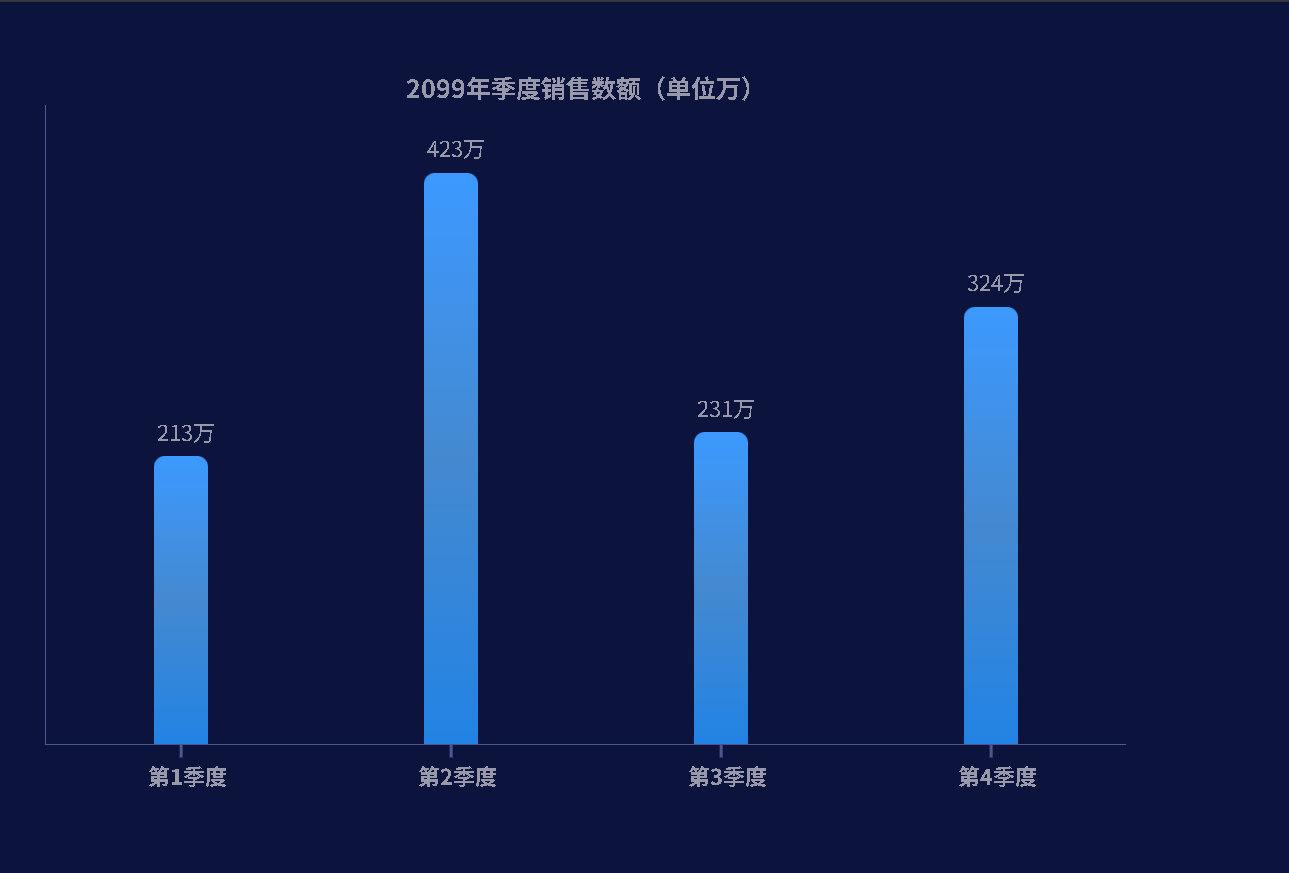
背景:根据不同季度的销售额,生成对应的柱形图,直观的看出差异
效果:
代码
<!DOCTYPE html>
<html lang="en">

<head>
  <meta charset="UTF-8">
  <meta http-equiv="X-UA-Compatible" content="IE=edge">
  <meta name="viewport" content="width=device-width, initial-scale=1.0">
  <title>Document</title>
  <style>
    * {
      margin: 0;
      padding: 0;
    }

    body {
      background-color: #0c143d;
    }

    .box {
      display: flex;
      justify-content: space-around;
      align-items: flex-end;
      width: 800px;
      min-height: 300px;
      border-left: 1px solid #4b578f;
      border-bottom: 1px solid #4b578f;
      margin: 0 auto;
      padding-top: 50px;
      text-align: center;
      color: #9799ab;
    }

    .box>div {
      position: relative;
      display: flex;
      flex-direction: column;
      justify-content: space-between;
      width: 40px;
      height: 0;
      background: linear-gradient(#3c99ff, #4489d0, #2283e4);
      cursor: pointer;
      border-radius: 8px 8px 0 0;
      transition: all .2s;
    }

    .box>div:hover {

      animation: bg .5s alternate infinite;

    }

    @keyframes bg {
      to {
        box-shadow: 0 5px 29px rgb(53 111 226 / 88%);
        background: linear-gradient(#3c99ff, #68aff6, #2283e4);
      }
    }

    .box>div::after {
      content: '';
      position: absolute;
      bottom: 0;
      left: 50%;
      width: 2px;
      height: 10px;
      background-color: #4b578f;
      transform: translate(-50%, 100%);
    }

    .box div span {
      width: 60px;
      margin: -30px 0 -5px -6px;
    }

    .box div h4 {
      width: 70px;
      margin: 0 0 -35px -10px;
    }

    .title {
      margin-top: 50px;
      text-align: center;
      color: #9799ab;
    }
  </style>
</head>

<body>
  <h3 class="title">2099年季度销售数额(单位万)</h3>
  <!-- <div class="box">
    <div style="height: 123px;" title="第1季度-123万">
      <span>123万</span>
      <h4>第1季度</h4>
    </div>
    <div style="height: 156px;" title="第2季度-156万">
      <span>156万</span>
      <h4>第2季度</h4>
    </div>
    <div style="height: 120px;" title="第3季度-120万">
      <span>120万</span>
      <h4>第3季度</h4>
    </div>
    <div style="height: 210px;" title="第4季度-210万">
      <span>210万</span>
      <h4>第4季度</h4>
    </div>
  </div> -->
  <script>
    // 功能1: 用户输入4次,并且把数据存放到数组里面

    // 1.1 声明一个空的数组
    let arr = []

    // 1.2 利用循环的形式让用户输入4次,并且把数据追加给数组
    for (let i = 1; i <= 4; i++) {
      let num = +prompt(`请您输入第${i}季度的销售额`)
      arr.push(num)
    }
    console.log(arr)

    // 功能2:根据数组生成柱形图

    // 2.1 声明一个空的字符串 str
    let str = ''

    // 2.2 利用循环拼接字符串,生成多个柱子
    for (let i = 0; i < arr.length; i++) {
      str += `
        <div style="height: ${arr[i]}px;" title="第${i + 1}季度-${arr[i]}万">
          <span>${arr[i]}万</span>
          <h4>第${i + 1}季度</h4>
        </div>
      `
    }
    console.log(str)

    // 2.3 把生成的柱子放到box盒子里面进行渲染
    document.write(`
      <div class="box">
        ${str}
      </div>
    `)
  </script>
</body>

</html>