前言
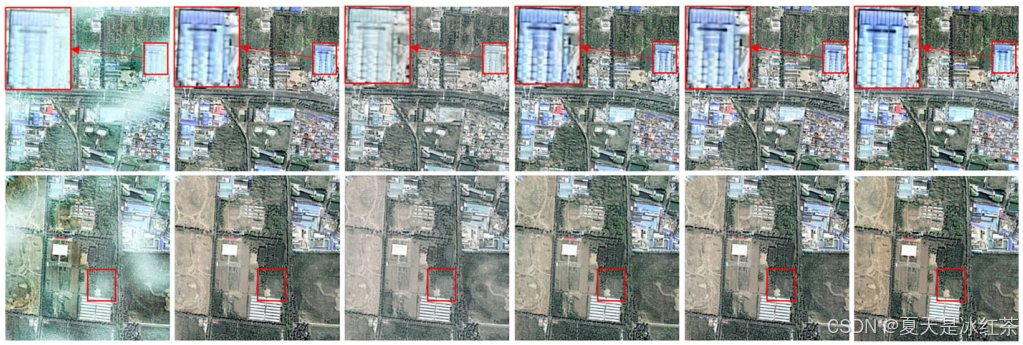
因为最近在搞毕业论文的事情,要做出一下图像细节对比图,所以我这里写了两个脚本,一个用于框选并同时预览图像放大细节,可显示并返回框选图像的坐标,另外一个是输入框选图像的坐标并将放大的细节放置在图像中,效果如下所示:
效果也是相当不错的,好了咱们也不必多说,就是教会大家怎么使用这两个脚本就可以了。
框选图像并预览放大细节
我们这里写了一个图像区域的选择工具,主要是选择好图像路径,框选和文字的颜色,以及放大的倍数,此处放大的倍数仅用于查看,所以不用担心最后的效果。
import cv2
def select_roi_region(image_path, line_color=(0, 255, 0), zoom_factor=3):
drawing = False
ix, iy = -1, -1
x, y, w, h = 0, 0, 0, 0
img = cv2.imread(image_path)
clone = img.copy()
# 鼠标回调函数
def mouse_callback(event, cur_x, cur_y, flags, param):
nonlocal ix, iy, drawing, x, y, w, h
if event == cv2.EVENT_LBUTTONDOWN:
drawing = True
ix, iy = cur_x, cur_y
x, y, w, h = 0, 0, 0, 0
elif event == cv2.EVENT_MOUSEMOVE and drawing:
temp_img = clone.copy()
cv2.rectangle(temp_img, (ix, iy), (cur_x, cur_y), line_color, 2)
x1, y1 = min(ix, cur_x), min(iy, cur_y)
x2, y2 = max(ix, cur_x), max(iy, cur_y)
if x2 > x1 and y2 > y1:
try:
roi = img[y1:y2, x1:x2]
if roi.size > 0:
enlarged = cv2.resize(roi, None, fx=3, fy=3,
interpolation=cv2.INTER_CUBIC)
cv2.imshow("Enlarged Preview", enlarged)
except Exception as e:
pass
cur_w = abs(cur_x - ix)
cur_h = abs(cur_y - iy)
if cur_w > 0 and cur_h > 0:
try:
roi = img[y1:y2, x1:x2]
enlarged = cv2.resize(roi, None, fx=zoom_factor, fy=zoom_factor,
interpolation=cv2.INTER_CUBIC)
cv2.imshow("Enlarged Preview", enlarged)
except:
pass
cv2.putText(temp_img, f"X:{x1} Y:{y1} W:{cur_w} H:{cur_h}",
(10, 30), cv2.FONT_HERSHEY_SIMPLEX, 0.7, line_color, 2)
cv2.imshow("Select ROI (SPACE=Clear | ENTER=Confirm)", temp_img)
elif event == cv2.EVENT_LBUTTONUP:
drawing = False
x = min(ix, cur_x)
y = min(iy, cur_y)
w = abs(cur_x - ix)
h = abs(cur_y - iy)
cv2.rectangle(clone, (x, y), (x + w, y + h), line_color, 2)
cv2.putText(clone, f"X:{x} Y:{y} W:{w} H:{h}", (10, 30),
cv2.FONT_HERSHEY_SIMPLEX, 0.7, line_color, 2)
cv2.imshow("Select ROI (SPACE=Clear | ENTER=Confirm)", clone)
cv2.namedWindow("Select ROI (SPACE=Clear | ENTER=Confirm)")
cv2.setMouseCallback("Select ROI (SPACE=Clear | ENTER=Confirm)", mouse_callback)
while True:
cv2.imshow("Select ROI (SPACE=Clear | ENTER=Confirm)", clone)
key = cv2.waitKey(1) & 0xFF
# 空格键:清除选择
if key == 32:
clone = img.copy()
ix, iy = -1, -1
x, y, w, h = 0, 0, 0, 0
try:
cv2.destroyWindow("Enlarged Preview") if cv2.getWindowProperty("Enlarged Preview", 0) >=0 else None
except:
pass
cv2.imshow("Select ROI (SPACE=Clear | ENTER=Confirm)", clone)
# 回车键:确认选择
if key == 13:
try:
cv2.destroyWindow("Enlarged Preview")
except:
pass
break
cv2.destroyAllWindows()
print(f"Final selection - X:{x} Y:{y} W:{w} H:{h}")
return (x, y, w, h)
if __name__=="__main__":
select_roi_region(
r'E:\PythonProject\img_processing_techniques_main\Enlarge_local_details\images\781.png'
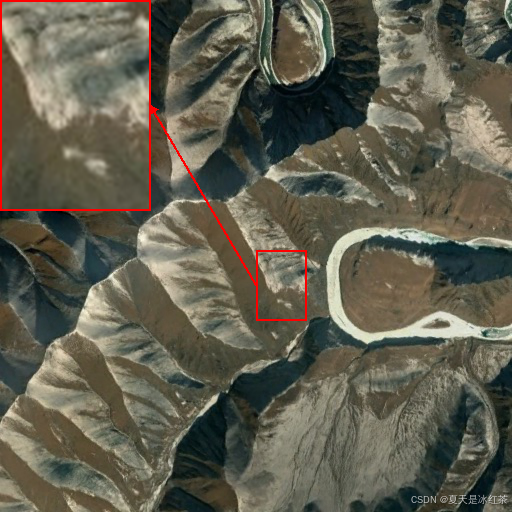
)下面是我们的这个使用效果:
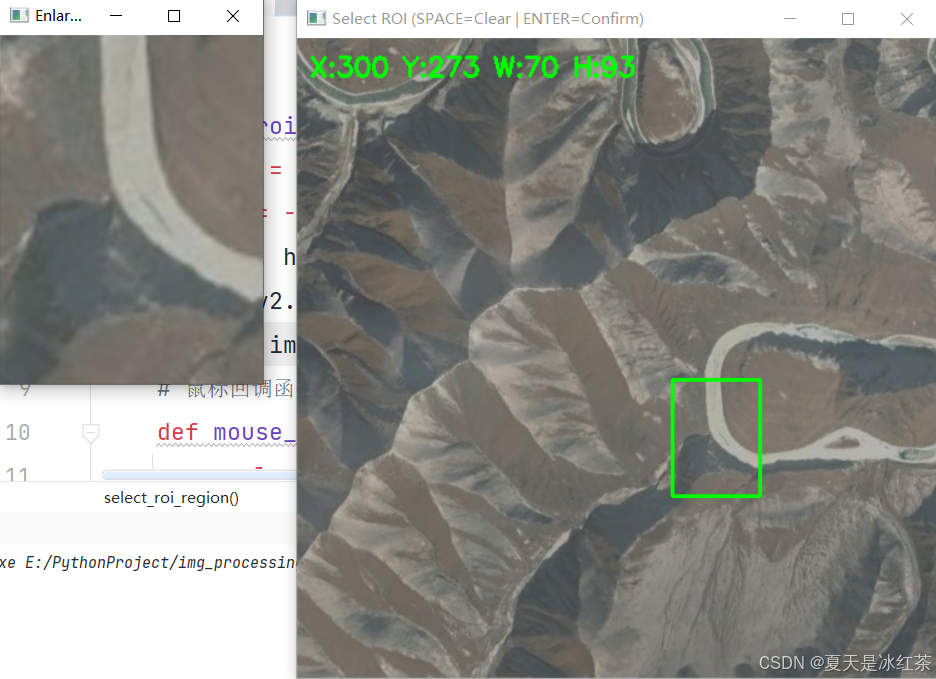
有一点问题就是在绘制好图像后再选框就会将文字遮挡住:
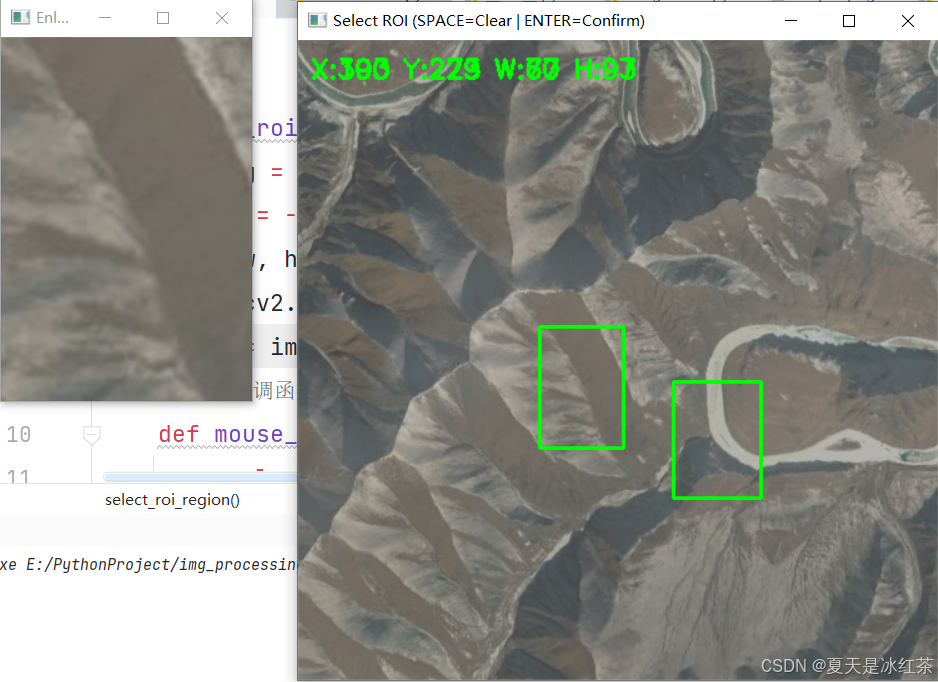
但是我们是提供了清楚键的,你只需要按下空格键就可以将全图的文字和框清理掉了,最后选择好合适的区域后,按下Enter键确定你框选的区域,以便进行下一步操作。
这里返回的坐标是(x,y,w,h),这种方式便于我们控制起始点和框的大小。
框选图像并放置放大细节
这里需要的是选择图像路径,框选的坐标,也提供放置位置的坐标,放大的系数,线条的颜色,宽度,以及是否绘制箭头。
如果你不提供放置的位置也可以,我们提供了一种自动计算位置的方法,主要就是比较框选区域的位置,然后计算出其对角线位置返回坐标。
import math
from PIL import Image, ImageDraw, ImageTk
def plot_highlight_region(image_path, region_to_zoom, paste_position=None, zoom_factor=3,
line_color="red", line_wide=2, show_arrow=True, arrow_size=5):
x, y, w, h = region_to_zoom
img = Image.open(image_path).convert("RGB")
img_w, img_h = img.size
original_copy = img.copy()
zoomed_w = int(w * zoom_factor)
zoomed_h = int(h * zoom_factor)
cropped = original_copy.crop((x, y, x + w, y + h))
zoomed = cropped.resize((zoomed_w, zoomed_h), Image.Resampling.LANCZOS)
if paste_position is None:
if x + w < img_w / 2:
paste_x = img_w - zoomed_w
else:
paste_x = 0
if y + h < img_h / 2:
paste_y = img_h - zoomed_h
else:
paste_y = 0
paste_x = max(0, min(paste_x, img_w - zoomed_w))
paste_y = max(0, min(paste_y, img_h - zoomed_h))
paste_position = (paste_x, paste_y)
img.paste(zoomed, paste_position)
draw = ImageDraw.Draw(img)
draw.rectangle([(x, y), (x + w, y + h)],
outline=line_color,
width=line_wide)
paste_x, paste_y = paste_position
draw.rectangle([paste_position,
(paste_x + zoomed_w, paste_y + zoomed_h)],
outline=line_color, width=line_wide)
if show_arrow:
def get_side_center(rect, side):
x, y, w, h = rect
return {
'left': (x, y + h // 2),
'right': (x + w, y + h // 2),
'top': (x + w // 2, y),
'bottom': (x + w // 2, y + h)
}[side]
src_rect = (x, y, w, h)
dst_rect = (paste_position[0], paste_position[1], zoomed_w, zoomed_h)
dx = (dst_rect[0] + zoomed_w / 2) - (x + w / 2)
dy = (dst_rect[1] + zoomed_h / 2) - (y + h / 2)
if abs(dx) > abs(dy):
src_side = 'right' if dx > 0 else 'left'
dst_side = 'left' if dx > 0 else 'right'
else:
src_side = 'bottom' if dy > 0 else 'top'
dst_side = 'top' if dy > 0 else 'bottom'
start_point = get_side_center(src_rect, src_side)
end_point = get_side_center(dst_rect, dst_side)
draw.line([start_point, end_point], fill=line_color, width=line_wide)
arrow_size = line_wide * arrow_size
angle = math.atan2(end_point[1] - start_point[1], end_point[0] - start_point[0])
p1 = (end_point[0] - arrow_size * math.cos(angle - math.pi / 6),
end_point[1] - arrow_size * math.sin(angle - math.pi / 6))
p2 = (end_point[0] - arrow_size * math.cos(angle + math.pi / 6),
end_point[1] - arrow_size * math.sin(angle + math.pi / 6))
draw.polygon([end_point, p1, p2], fill=line_color)
return img
if __name__ == "__main__":
# 定义要放大的区域 (x, y, width, height)
region_to_zoom = (256, 250, 50, 70)
im_path = r'E:\PythonProject\img_processing_techniques_main\Enlarge_local_details\gtimage\781.png'
im = plot_highlight_region(im_path, region_to_zoom)
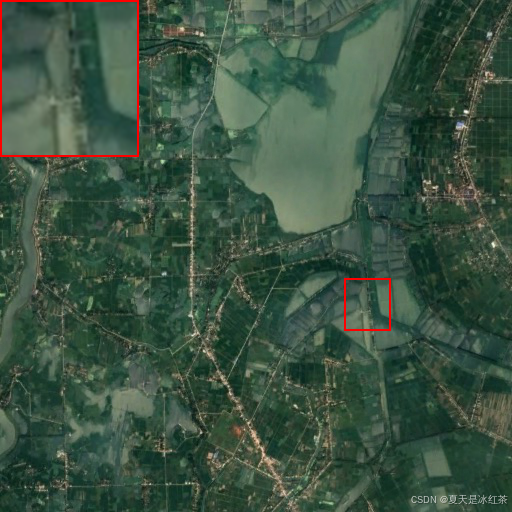
im.save("output.png")我们先来看看,提供了放置坐标的效果:
if __name__ == "__main__":
    # 定义要放大的区域 (x, y, width, height)
    region_to_zoom = (256, 250, 50, 70)
    im_path = r'E:\PythonProject\img_processing_techniques_main\Enlarge_local_details\gtimage\861.png'
    im = plot_highlight_region(im_path, region_to_zoom, (22, 22))
    im.save("output.png")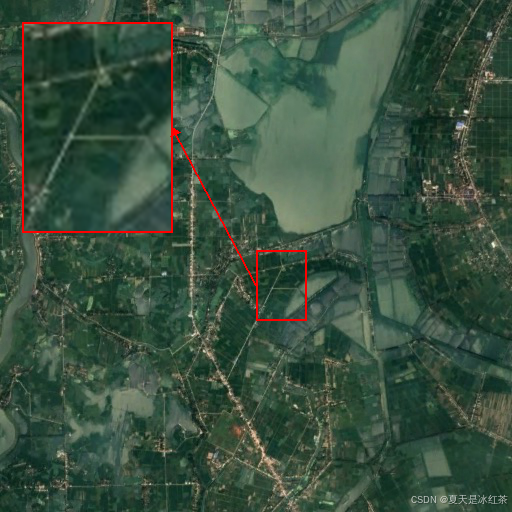
自动计算的效果:
if __name__ == "__main__":
    # 定义要放大的区域 (x, y, width, height)
    region_to_zoom = (22, 22, 50, 70)
    im_path = r'E:\PythonProject\img_processing_techniques_main\Enlarge_local_details\gtimage\861.png'
    im = plot_highlight_region(im_path, region_to_zoom)
    im.save("output.png")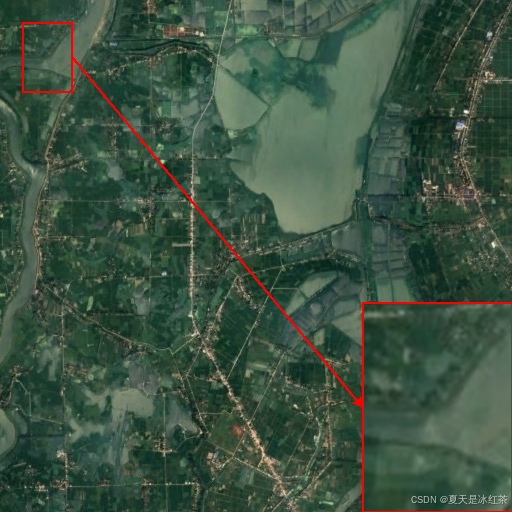
当然这里的自动计算还只是四个角。目前来说也算足够了。
关闭箭头的效果:
if __name__ == "__main__":
    # 定义要放大的区域 (x, y, width, height)
    region_to_zoom = (300, 250, 50, 70)
    im_path = r'E:\PythonProject\img_processing_techniques_main\Enlarge_local_details\gtimage\861.png'
    im = plot_highlight_region(im_path, region_to_zoom, show_arrow=False)
    im.save("output.png")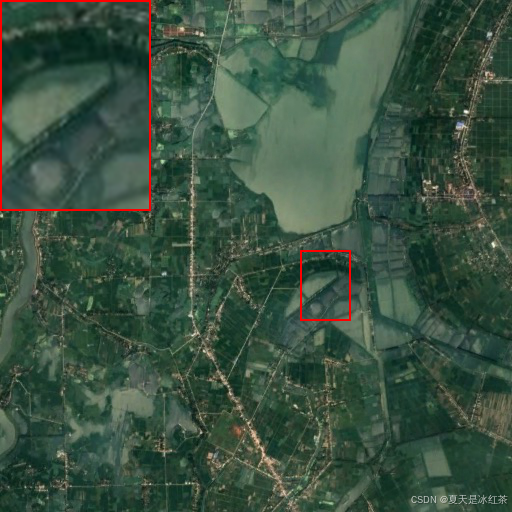
总结
如果只需要画框那么直接用下面的简略版本即可:
def highlight_region(image_path, region_to_zoom, line_color="red", line_wide=2):
x, y, w, h = region_to_zoom
img = Image.open(image_path).convert("RGB")
img_copy = img.copy()
draw = ImageDraw.Draw(img)
draw.rectangle(
[(x, y), (x + w, y + h)],
outline=line_color,
width=line_wide
)
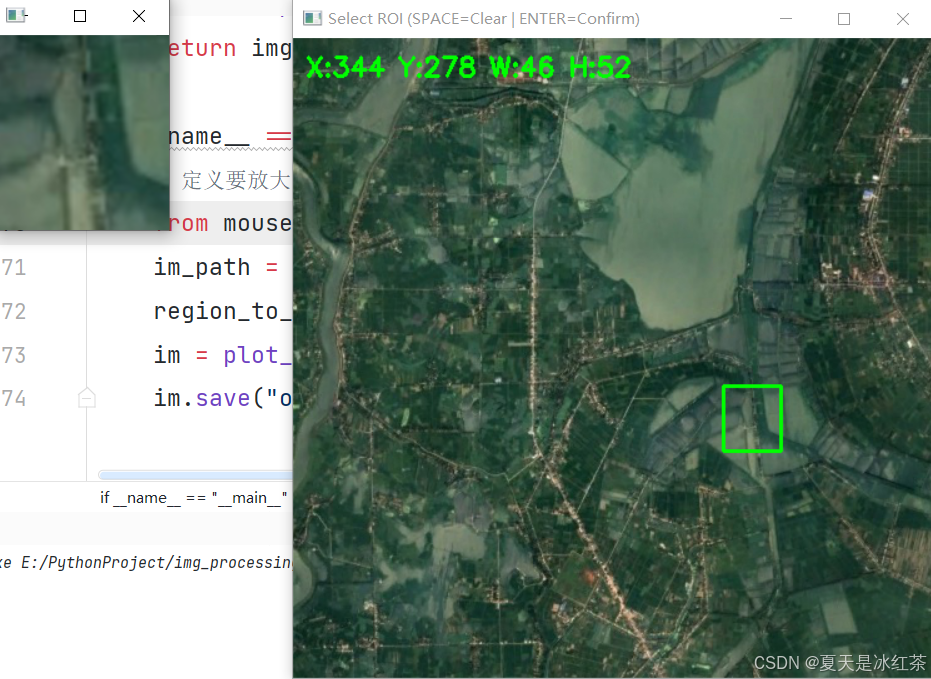
return img我们将前面的两个脚本组合在一起,便于我们更好的观察
if __name__ == "__main__":
    # 定义要放大的区域 (x, y, width, height)
    from mouse import select_roi_region
    im_path = r'E:\PythonProject\img_processing_techniques_main\Enlarge_local_details\gtimage\861.png'
    region_to_zoom = select_roi_region(im_path)
    im = plot_highlight_region(im_path, region_to_zoom, show_arrow=False)
    im.save("output.png")
这里会先运行预选框程序,等按下Enter键之后会直接返回坐标。
我们的图像就生成好了:
写完这篇我还得继续去画图了。