
在现代前端开发中,数据分析与可视化 是提升用户体验和决策效率的重要手段。在数据分析和可视化场景中,透视表(Pivot Table)是极为常用的组件。它能够灵活地对原始数据进行分组、汇总和多维展示。
本文将以一个基于 Angular 框架 的项目为例,逐步演示如何从最基础的数据表格出发,逐步构建出功能强大、结构清晰、性能优良的透视表组件。
V1:基础数据表格
首先,我们展示最原始的数据表格。该表格直接将数据源中的每一条记录以行的形式展现,便于查看原始数据内容。这种方式适用于数据量较小、结构简单的场景。但通常情况下一个表格会比较长。

V2:嵌套分组表格
嵌套分组是常见的需求。这样可以缩短列表长度。还能通过展开/收起分组提升数据可读性。适合层级结构明显的数据。
在V1表格基础上实现了按class分组的嵌套展示。这里通过展开/收起分组,可以清晰的看到每个班级的学生分数情况。
  <table mat-table [dataSource]="dataSource" class="score-table score-table-nested mat-elevation-z1">
    <!-- Group Header Row -->
    <ng-container matColumnDef="group">
      <td mat-cell *matCellDef="let group" [attr.colspan]="displayedColumns.length" (click)="toggleScoreExpand(group.className)" class="expandable-row" style="cursor:pointer;">
        {{ group.className }}
        <span class="inline-arrow">{{ expandedScores.has(group.className) ? '↓' : '→' }}</span>
        <div class="arrow"> ... </div>
      </td>
    </ng-container>
    <!-- Student Column -->
    <ng-container matColumnDef="student">
      <th mat-header-cell *matHeaderCellDef>Class</th>
      <td mat-cell *matCellDef="let row">{{ row.student }}</td>
    </ng-container>
    <ng-container matColumnDef="year">
      <th mat-header-cell *matHeaderCellDef>Year</th>
      <td mat-cell *matCellDef="let row">{{ row.year }}</td>
    </ng-container>
    <ng-container matColumnDef="score">
      <th mat-header-cell *matHeaderCellDef>Score</th>
      <td mat-cell *matCellDef="let row">{{ row.score }}</td>
      </ng-container>
    <ng-container matColumnDef="level">
      <th mat-header-cell *matHeaderCellDef>Level</th>
      <td mat-cell *matCellDef="let row">{{ row.level }}</td>
    </ng-container>

    <!-- Header row for details -->
    <tr mat-header-row *matHeaderRowDef="displayedColumns"></tr>
    <!-- Group row -->
    <tr mat-row *matRowDef="let row; columns: ['group']; when: isGroup"></tr>
    <!-- Expanded detail rows -->
    <tr mat-row *matRowDef="let row; columns: displayedColumns; when: isDetail"></tr>
  </table>
  <mat-paginator [pageSize]="10" [pageSizeOptions]="[10]" showFirstLastButtons [hidePageSize]="true"></mat-paginator>
 export class ScoreGroupedTableComponent implements OnInit {

    @ViewChild(MatPaginator) paginator!: MatPaginator;
    @Input() data: any[] = [];
    expandedScores = new Set<string>();
    displayedColumns: string[] = ['student', 'year', 'score', 'level'];
    groupedData: any[] = [];
    dataSource = new MatTableDataSource<any>();
    ngOnInit() {
      this.updateGroupedData();
      setTimeout(() => {
        if (this.dataSource && this.paginator) {
          this.dataSource.paginator = this.paginator;
        }
      });
    }

    toggleScoreExpand(className: string) {
      if (this.expandedScores.has(className)) {
        this.expandedScores.delete(className);
      } else {
        this.expandedScores.add(className);
      }
      this.updateGroupedData();
    }

    isGroup = (_: number, item: any) => item.isGroup === true;
    isDetail = (_: number, item: any) => !item.isGroup;

    updateGroupedData() {
      if (!this.data) {
        this.groupedData = [];
        return;
      }
      // Group by className
      const groups: any[] = [];
      const grouped = this.data.reduce((acc: Record<string, any[]>, row: any) => {
        acc[row.className] = acc[row.className] || [];
        acc[row.className].push(row);
        return acc;
      }, {} as Record<string, any[]>);
      Object.keys(grouped).forEach(className => {
        groups.push({ isGroup: true, className });
        if (this.expandedScores.has(className)) {
          groups.push(...grouped[className].map((row: any) => ({ ...row, isGroup: false })));
        }
      });
      this.groupedData = groups;
      this.dataSource.data = this.groupedData;
      if (this.paginator) {
        this.dataSource.paginator = this.paginator;
      }
    }
  }

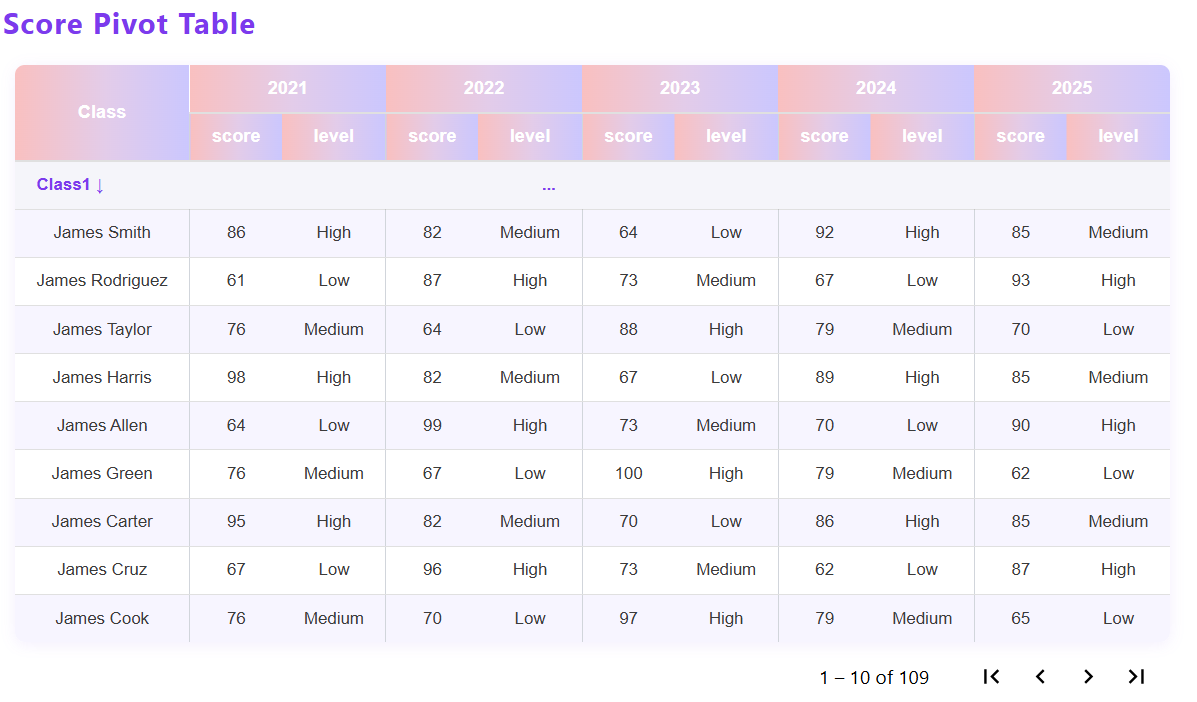
V3:分组嵌套透视表格
这时候在V2的基础上,我们可以对数据进行透视,例如,将 Year作为一级表头,统计每年学生的分数形成横向对比减少数据行数。实现更清晰的结构分区和更强的数据对比能力。
旨在应对高复杂度、多维度、层级嵌套的数据分析需求。
亮点功能:
• 表头支持多级嵌套,视觉层次分明;
• 支持任意维度组合;
数据驱动渲染:
• 所有表头与单元格均由数据动态生成;
• 支持缺失值处理与默认占位符(如 ‘-’);
• 可扩展为支持多指标(如 test、rank、score 等)展示。
适用场景:
• 需要按维度进行横向对比,进行复杂的交叉分析
• 数据维度较多,需清晰展示结构;
  <table mat-table [dataSource]="dataSource" class="score-table score-table-nested mat-elevation-z1">
    <!-- Group Header Row -->
    <ng-container matColumnDef="group">
      <td mat-cell *matCellDef="let group" [attr.colspan]="displayedColumns.length" (click)="toggleScoreExpand(group.className)" class="expandable-row" style="cursor:pointer;">
        {{ group.className }}
        <span class="inline-arrow">{{ expandedScores.has(group.className) ? '↓' : '→' }}</span>
        <div class="arrow"> ... </div>
      </td>
    </ng-container>
    <!-- Student Column -->
    <ng-container matColumnDef="student">
      <th mat-header-cell *matHeaderCellDef rowspan="2">Class</th>
      <td mat-cell *matCellDef="let row">{{ row.student }}</td>
    </ng-container>
    <!-- Year Grouped Header for colspan -->
    @for (year of yearColumnsGroup; track $index) {
      <ng-container [matColumnDef]="'yearGroup_' + year">
        <th mat-header-cell *matHeaderCellDef colspan="2">{{ year }}</th>
      </ng-container>
    }
    <!-- Score/Level Columns -->
      @for (year of yearColumnsGroup; track $index) {
      <ng-container [matColumnDef]="'score_' + year">
        <th mat-header-cell *matHeaderCellDef class="section-border-left">score</th>
        <td mat-cell *matCellDef="let row" class="section-border-left">{{ row['score_' + year] }}</td>
      </ng-container>
      <ng-container [matColumnDef]="'level_' + year">
        <th mat-header-cell *matHeaderCellDef>level</th>
        <td mat-cell *matCellDef="let row">{{ row['level_' + year] }}</td>
      </ng-container>
      }
    <!-- First header row: Class and year groups -->
    <tr mat-header-row *matHeaderRowDef="headerRowDef1"></tr>
    <!-- Second header row: score/level (no student) -->
    <tr mat-header-row *matHeaderRowDef="yearColumns"></tr>
    <tr mat-row *matRowDef="let row; columns: ['group']; when: isGroup"></tr>
    <tr mat-row *matRowDef="let row; columns: displayedColumns; when: isDetail"></tr>
  </table>
  <mat-paginator [pageSize]="10" [pageSizeOptions]="[10]" showFirstLastButtons [hidePageSize]="true"></mat-paginator>
  export class ScorePivotTableComponent implements OnInit {
    @ViewChild(MatPaginator) paginator!: MatPaginator;
    @Input() data: any[] = [];
    expandedScores = new Set<string>();
    displayedColumns: string[] = [];
    yearColumns: string[] = [];
    yearColumnsGroup: string[] = [];
    headerRowDef1: string[] = [];
    groupedData: any[] = [];
    dataSource = new MatTableDataSource<any>();

    ngOnInit() {
      this.updateGroupedData();
      setTimeout(() => {
        if (this.dataSource && this.paginator) {
          this.dataSource.paginator = this.paginator;
        }
      });
    }

    toggleScoreExpand(className: string) {
      this.expandedScores.has(className)
        ? this.expandedScores.delete(className)
        : this.expandedScores.add(className);
      this.updateGroupedData();
    }

    isGroup = (_: number, item: any) => item.isGroup === true;
    isDetail = (_: number, item: any) => !item.isGroup;

    updateGroupedData() {
      if (!this.data) {
        this.groupedData = [];
        return;
      }
      const years = Array.from(new Set(this.data.map(row => row.year))).sort();
      this.yearColumnsGroup = years;
      this.yearColumns = years.flatMap(year => [`score_${year}`, `level_${year}`]);
      this.displayedColumns = ['student', ...this.yearColumns];
      this.headerRowDef1 = ['student', ...years.map(y => 'yearGroup_' + y)];
      const grouped = this.data.reduce((acc: Record<string, any[]>, row: any) => {
        (acc[row.className] ||= []).push(row);
        return acc;
      }, {} as Record<string, any[]>);
      const groups: any[] = [];
      for (const className in grouped) {
        groups.push({ isGroup: true, className });
        if (this.expandedScores.has(className)) {
          const students = Array.from(new Set(grouped[className].map((row: any) => row.student)));
          for (const student of students) {
            const studentRow: any = { isGroup: false, student };
            for (const year of years) {
              const found = grouped[className].find((row: any) => row.student === student && row.year === year);
              studentRow[`score_${year}`] = found?.score ?? '';
              studentRow[`level_${year}`] = found?.level ?? '';
            }
            groups.push(studentRow);
          }
        }
      }
      this.groupedData = groups;
      this.dataSource.data = this.groupedData;
      if (this.paginator) {
        this.dataSource.paginator = this.paginator;
      }
    }
  }
优化建议
• 数据结构设计:建议在后端或服务层预处理数据,减少前端计算压力;
• 组件解耦:将透视逻辑封装为服务,提升复用性;
• 交互增强:可加入字段拖拽、动态维度选择、导出 Excel 等功能;
• 可视化联动:结合图表库实现图表与表格联动展示。
总结
通过以上三个阶段的实践,我们可以看到 Angular 在实现透视表和复杂表格方面的强大能力。无论是基础表格、单维透视、多维分组,还是嵌套分组与多维透视的结合,都可以通过合理的数据结构设计和模板渲染轻松实现。希望本文能为你在实际项目中实现和优化透视表提供参考和启发!