如何在 Kubernetes 上高效部署 Prometheus 监控系统?下面将详细介绍如何部署,一起看看吧!
- Kubernetes:v1.29.0
- Prometheus:v3.5.0
1、创建命名空间
# 为监控组件创建一个专用命名空间:monitoring
# monitoring-namespace.yaml
apiVersion: v1
kind: Namespace
metadata:
  name: monitoring

# 应用
kubectl apply -f monitoring-namespace.yaml
2、部署 Prometheus
2.1、创建 ConfigMap
# prometheus-config.yaml
# 此处仅添加 prometheus 自己指标
apiVersion: v1
kind: ConfigMap
metadata:
  name: prometheus-config
  namespace: monitoring
data:
  prometheus.yml: |
    global:
      scrape_interval:     15s
      evaluation_interval: 15s
    scrape_configs:
      - job_name: 'prometheus'
        static_configs:
        - targets: ['localhost:9090']

# 应用
kubectl apply -f prometheus-config.yaml
2.2、创建 ClusterRole 并绑定 ServiceAccount
# prometheus-role.yaml
apiVersion: rbac.authorization.k8s.io/v1
kind: ClusterRole
metadata:
  name: prometheus
rules:
- apiGroups: [""]
  resources:
  - nodes
  - nodes/proxy
  - services
  - endpoints
  - pods
  verbs: ["get", "list", "watch"]
- apiGroups:
  - extensions
  resources:
  - ingresses
  verbs: ["get", "list", "watch"]
- nonResourceURLs: ["/metrics"]
  verbs: ["get"]
---
apiVersion: v1
kind: ServiceAccount
metadata:
  name: prometheus
  namespace: monitoring
---
apiVersion: rbac.authorization.k8s.io/v1
kind: ClusterRoleBinding
metadata:
  name: prometheus
roleRef:
  apiGroup: rbac.authorization.k8s.io
  kind: ClusterRole
  name: prometheus
subjects:
- kind: ServiceAccount
  name: prometheus
  namespace: monitoring

# 应用
kubectl apply -f prometheus-role.yaml
2.3、创建 Deployment
# 数据持久化时(data-volume)使用 PersistentVolume 而不是 emptyDir
# 生产环境中还需配置资源 limits 和 requests
# prometheus-deployment.yaml
apiVersion: apps/v1
kind: Deployment
metadata:
  name: prometheus
  namespace: monitoring
spec:
  replicas: 1
  selector:
    matchLabels:
      app: prometheus
  template:
    metadata:
      labels:
        app: prometheus
    spec:
      serviceAccountName: prometheus
      serviceAccount: prometheus
      containers:
      - name: prometheus
        image: prom/prometheus:v3.5.0
        args:
        - '--config.file=/etc/prometheus/prometheus.yml'
        - '--web.enable-lifecycle'
        - '--no-storage.tsdb.wal-compression'
        ports:
        - containerPort: 9090
          protocol: TCP
        volumeMounts:
        - name: prometheus-config
          mountPath: /etc/prometheus
        - name: data-volume
          mountPath: /prometheus
      volumes:
      - name: prometheus-config
        configMap:
          name: prometheus-config
      - name: data-volume
        emptyDir: {}

# 应用
kubectl apply -f prometheus-deployment.yaml
2.4、创建 Service
# 生产环境中,建议使用 Ingress 而不是 NodePort 暴露服务
# prometheus-service.yaml
apiVersion: v1
kind: Service
metadata:
  name: prometheus
  namespace: monitoring
  labels:
    name: prometheus
spec:
  ports:
  - name: prometheus
    protocol: TCP
    port: 9090
    targetPort: 9090
  selector:
    app: prometheus
  type: NodePort

# 应用
kubectl apply -f prometheus-service.yaml
3、添加 Target-coredns 案例
- CoreDNS 内置 Prometheus 监控指标支持(默认 http://<coredns-pod-ip>:9153/metrics)
- 通过配置使用 Prometheus 能获取到这些指标
# CoreDNS 通常已经创建对应的 Service(kube-dns)
# 可通过地址访问:http://kube-dns.kube-system.svc.cluster.local:9153/metrics
# 配置 Prometheus 的 prometheus.yml
apiVersion: v1
kind: ConfigMap
metadata:
  name: prometheus-config
  namespace: monitoring
data:
  prometheus.yml: |
    global:
      scrape_interval:     15s
      evaluation_interval: 15s
    scrape_configs:
      - job_name: 'prometheus'
        static_configs:
        - targets: ['localhost:9090']
      - job_name: 'coredns'
        metrics_path: '/metrics'
        static_configs:
        - targets: ['kube-dns.kube-system.svc.cluster.local:9153']

# CoreDNS 提供的主要指标包括
# coredns_dns_requests_total - DNS 请求的总数量
# coredns_dns_request_duration_seconds - 请求处理时间
# coredns_dns_response_size_bytes - 响应大小
# coredns_plugin_enabled - 启用的插件信息
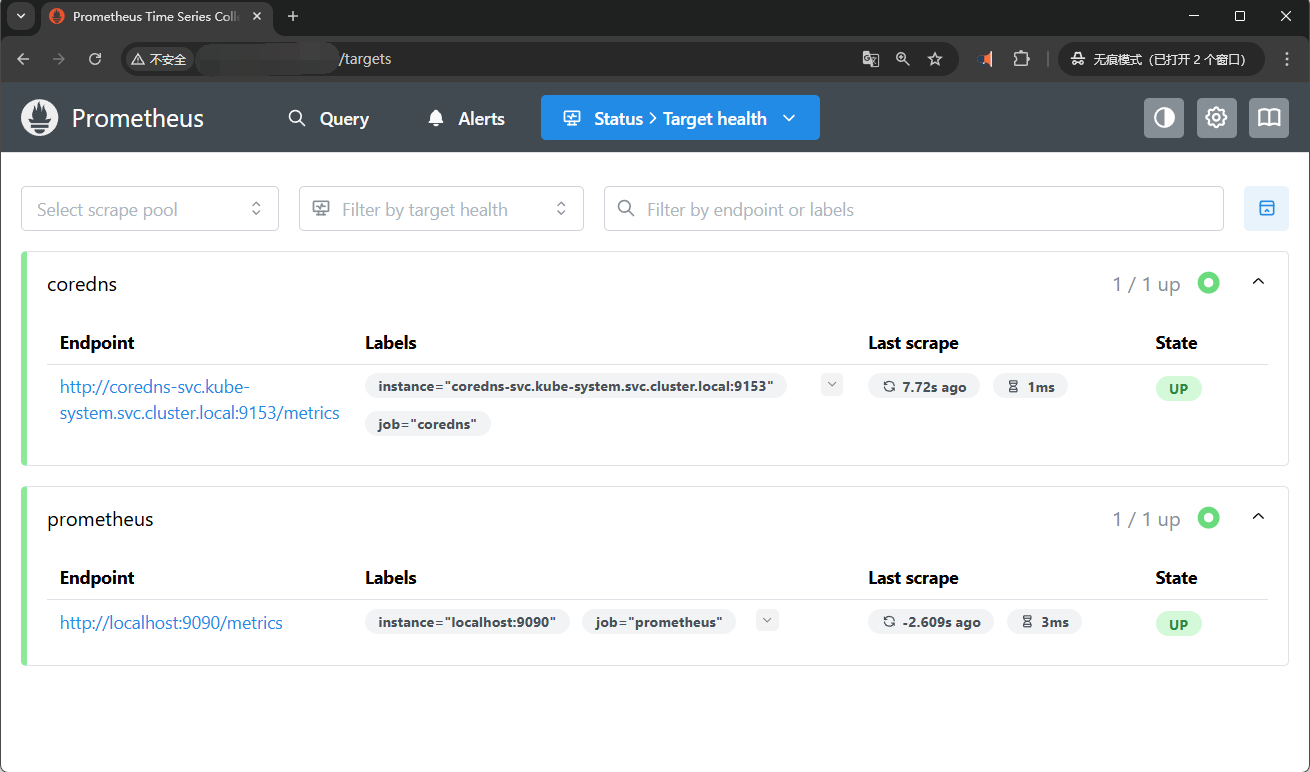
- 浏览器访问 http:<node-ip>:<prometheus-NodePort>/targets 就可看到添加的 coredns