目录
安装及部署知识拓展
exporter
prometheus
grafana
alertmanager
flowchart TD
    subgraph A [数据提供层 -  exporters]
        direction LR
        A1[Node Exporter]
        A2[MySQL Exporter]
        A3[其他业务 Exporter]
    end

    subgraph B [数据采集与存储层 -  prometheus]
        B1[抓取/拉取模式<br>定时从exporter拉取数据]
        B2[时序数据库<br>存储抓取到的指标数据]
        B3[告警规则<br>根据规则计算并触发警报]
    end

    subgraph C [数据可视化与告警层 -  grafana]
        direction LR
        C1[数据源]
        C2[仪表盘]
        C3[告警通知]
    end

    A -- 暴露HTTP端点<br>/metrics --> B1
    B -- 作为数据源<br>提供查询接口 --> C1
    C1 -- 编写查询语句<br>PromQL --> C2
    B3 -- 发送警报 --> D[Alertmanager]
    D -- 推送通知 --> E[邮箱/钉钉/Slack]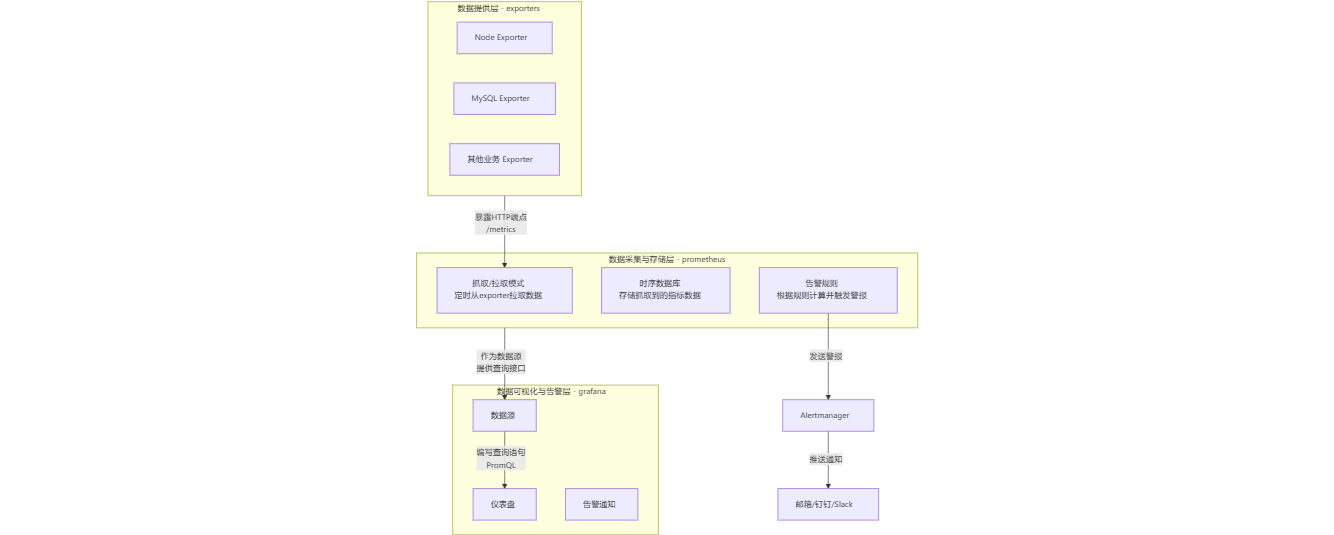
各个组件的作用
1. Exporter(导出器)
- 作用:数据暴露和转换
- 核心任务: 将各种系统、服务、应用程序的内部状态和指标(如 Linux 的系统指标、MySQL 的数据库状态、Nginx 的请求统计)抓取出来,并转换(export)成 Prometheus 能够理解的格式。
- 工作方式: 它本身是一个独立的守护进程,会在目标机器上启动一个 HTTP 服务(默认端口通常为 9100、9200 等),并提供一个
/metrics接口。当你访问这个接口时,它会返回纯文本格式的监控数据。 - 特点: 它只负责暴露数据,不负责采集和存储。
- 常见例子:
- Node Exporter: 用于暴露服务器硬件和操作系统指标(CPU、内存、磁盘、网络)。
- MySQL Exporter: 用于暴露 MySQL 数据库的性能指标(查询数、连接数、慢查询等)。
- cAdvisor: 用于暴露 Docker 容器的资源使用情况。
- Blackbox Exporter: 用于探活,暴露网络探测结果(如 HTTP、TCP、ICMP 是否通畅)。
2. Prometheus(普罗米修斯)
- 作用:数据采集、存储和告警
- 核心任务1 - 拉取采集: Prometheus 服务器会定期(根据配置)主动去拉取(Pull) 各个 Exporter 提供的
/metrics接口数据。这是一种非常重要的设计模式(与传统的推送模式相反)。 - 核心任务2 - 时序数据库: 它将采集到的所有时间序列数据(Time-Series Data)存储在自己内置的高效时序数据库中。
- 核心任务3 - 查询: 提供了强大的查询语言 PromQL,让你可以对存储的指标数据进行非常灵活的组合、聚合和分析。
- 核心任务4 - 告警(Alert): 你可以在 Prometheus 中配置告警规则(Alerting Rules)。Prometheus 会根据规则持续计算,如果条件满足,它会生成一条告警。但请注意,它通常不直接处理告警通知的发送。
- 核心任务1 - 拉取采集: Prometheus 服务器会定期(根据配置)主动去拉取(Pull) 各个 Exporter 提供的
- 特点: 它是整个系统的核心大脑,负责数据抓取、存储和计算。
3. Grafana(格拉法纳)
- 作用:数据可视化和告警通知
- 核心任务1 - 可视化: 它是一个专业的可视化平台,可以从多种数据源(其中最主要的就是 Prometheus)读取数据,然后绘制成非常美观的仪表盘(Dashboard),包括图表、图形、表格等。
- 核心任务2 - 告警通知(Notification): 它可以从 Prometheus 接收告警信息,并提供比 Prometheus 更友好的告警管理和通知功能(但更专业的告警处理通常交给 Alertmanager)。Grafana 的告警功能强大到可以直接在图表上定义告警规则。
- 特点: 它是整个系统的颜值担当和界面,专注于展示和告警通知,本身不存储监控数据。
4. Alertmanager(告警管理器)
- 作用:告警的聚合、去重和分发
- 核心任务: 专门处理由 Prometheus(或Grafana)生成的告警。它接收大量告警后,会进行分组(Grouping)、抑制(Inhibition)、静默(Silence) 和去重(Deduplication),然后通过正确的渠道(如邮件、钉钉、Slack、PagerDuty等)发送给正确的人。
- 特点: 它是专业的告警处理中心,防止告警风暴,确保告警信息有效送达。
它们之间的联系(工作流程)
一个完整的监控流程是这样的:
- 暴露指标: 你在需要监控的目标(如服务器、数据库)上运行对应的 Exporter。Exporter 开始工作,提供
/metrics端点。 - 采集指标: Prometheus 服务器根据配置文件中的
scrape_configsjob,定期(如每15秒)去访问这些 Exporter 的端点,拉取指标数据,并存储到自己的时序数据库中。 - 定义告警规则: 你在 Prometheus 配置文件中定义告警规则(Alerting Rules)。Prometheus 持续计算,一旦触发告警,它会将告警信息推送给 Alertmanager。
- 处理与发送告警: Alertmanager 接收到告警,进行一系列处理后,通过配置好的接收器(Receiver)将告警消息发送出去。
- 可视化监控: 你在 Grafana 中配置 Prometheus 作为数据源。然后创建仪表盘,使用 PromQL 编写查询语句,从 Prometheus 中获取数据并绘制成精美的图表。
- (可选) 在Grafana中定义告警: 你也可以直接在 Grafana 的图表上定义告警规则,Grafana 会自己去查询 Prometheus 的数据并判断是否触发告警,然后通过 Grafana 配置的通知渠道(如邮件)发送出去。
总结与类比
- Exporter = 仪表盘(如汽车的速度表、油表):负责显示原始数据。
- Prometheus = 数据记录员 + 分析员:定期去看各个仪表盘并记录读数(采集),然后根据规则分析这些记录(计算和告警)。
- Alertmanager = 专业的报警调度中心:接到分析员的报警电话后,决定如何分组、抑制,并最终通知给谁。
- Grafana = 炫酷的监控大屏 + UI界面:把记录员记录的所有数据用各种华丽的图表展示出来,让你一目了然。
一、prometheus部署
安装软件包
alertmanager-0.28.1.linux-amd64.tar.gz
grafana-enterprise-11.6.0-1.x86_64.rpm
prometheus-3.3.0.linux-amd64.tar.gz
node_exporter-1.8.2.linux-amd64.tar.gz
解压
[root@prometheus ~]# tar xf prometheus-3.3.0.linux-amd64.tar.gz prometheus 移动并创建到 /usr/local/prommetheus/目录下
[root@prometheus ~]# cd prometheus-3.3.0.linux-amd64/
[root@prometheus prometheus-3.3.0.linux-amd64]# ls
LICENSE  NOTICE  prometheus  prometheus.yml  promtool
[root@prometheus prometheus-3.3.0.linux-amd64]# cd
[root@prometheus ~]# mv prometheus-3.3.0.linux-amd64 /usr/local/prometheus
[root@prometheus ~]# cd /usr/local/prometheus/
[root@prometheus prometheus]# ls
LICENSE  NOTICE  prometheus  prometheus.yml  promtool
链接prometheus命令
[root@prometheus prometheus]# ln -s /usr/local/prometheus/* /usr/local/sbin/
[root@prometheus prometheus]# cd
[root@prometheus ~]# pro
prometheus     protoc         protoc-c       prove
运行prometheus
[root@prometheus ~]# nohup prometheus --config.file=/usr/local/prometheus/prometheus.yml &
[1] 6718
[root@prometheus ~]# nohup: 忽略输入并把输出追加到 'nohup.out'
后台运行

[root@prometheus ~]# ls
alertmanager-0.28.1.linux-amd64.tar.gz  grafana-enterprise-11.6.0-1.x86_64.rpm
anaconda-ks.cfg                         nohup.out
data                                    prometheus-3.3.0.linux-amd64.tar.gz
查看prometheus端口
[root@prometheus node]# netstat -anptu | grep 9090
tcp6       0      0 :::9090                 :::*                    LISTEN      6718/prometheus
tcp6       0      0 ::1:9090                ::1:45118               ESTABLISHED 6718/prometheus
tcp6       0      0 ::1:45118               ::1:9090                ESTABLISHED 6718/prometheus
prometheus会将运行内容信息输出到nohup.out
[root@prometheus ~]# cat nohup.out
time=2025-09-11T10:54:39.683Z level=INFO source=main.go:640 msg="No time or size retention was set so using the default time retention" duration=15d
time=2025-09-11T10:54:39.683Z level=INFO source=main.go:687 msg="Starting Prometheus Server" mode=server version="(version=3.3.0, branch=HEAD, revision=3c49e69330ceee9c587a1d994c78535695edff16)"
time=2025-09-11T10:54:39.683Z level=INFO source=main.go:692 msg="operational information" build_context="(go=go1.24.1, platform=linux/amd64, user=root@b362765c931d, date=20250415-13:32:00, tags=netgo,builtinassets,stringlabels)" host_details="(Linux 6.6.0-79.0.0.84.oe2403sp1.x86_64 #1 SMP Wed Feb 26 16:02:55 CST 2025 x86_64 prometheus (none))" fd_limits="(soft=524287, hard=524288)" vm_limits="(soft=unlimited, hard=unlimited)"
time=2025-09-11T10:54:39.684Z level=INFO source=main.go:768 msg="Leaving GOMAXPROCS=2: CPU quota undefined" component=automaxprocs
time=2025-09-11T10:54:39.700Z level=INFO source=web.go:654 msg="Start listening for connections" component=web address=0.0.0.0:9090
两种链接方式
第一种,alertmanager将数据直接给到prometheus,然后grafana连接prometheus就行了
第二种,altermanager作为一个单独的数据源用,grafana连接altermanager
下面采用第二种方式:
安装软件包
node_exporter-1.8.2.linux-amd64.tar.gz
与上面prometheus操作相同
[root@prometheus ~]# ls
alertmanager-0.28.1.linux-amd64.tar.gz  node_exporter-1.8.2.linux-amd64.tar.gz
anaconda-ks.cfg                         nohup.out
data                                    prometheus-3.3.0.linux-amd64.tar.gz
grafana-enterprise-11.6.0-1.x86_64.rpm
[root@prometheus ~]# tar xf node_exporter-1.8.2.linux-amd64.tar.gz
[root@prometheus ~]# mv node_exporter-1.8.2.linux-amd64 /usr/local/node
[root@prometheus ~]# cd /usr/local/node/
[root@prometheus node]# ls
LICENSE  node_exporter  NOTICE
[root@prometheus node]# nohup ./node_exporter &
[2] 10245
[root@prometheus node]# nohup: 忽略输入并把输出追加到 'nohup.out'

[root@prometheus node]#
查看exporter监听端口
[root@prometheus node]# netstat -anptu | grep node
tcp6       0      0 :::9100                 :::*                    LISTEN      10245/./node_export
写数据,让9090能去9100拉取数据(pull)
编辑Prometheus.yml文件
添加
[root@prometheus node]# cd /usr/local/prometheus/
[root@prometheus prometheus]# ls
LICENSE  NOTICE  prometheus  prometheus.yml  promtool
[root@prometheus prometheus]# vim prometheus.yml

#这里设置为指向本机

  - job_name: 'localhost'
    static_configs:
    - targets: ['localhost:9100']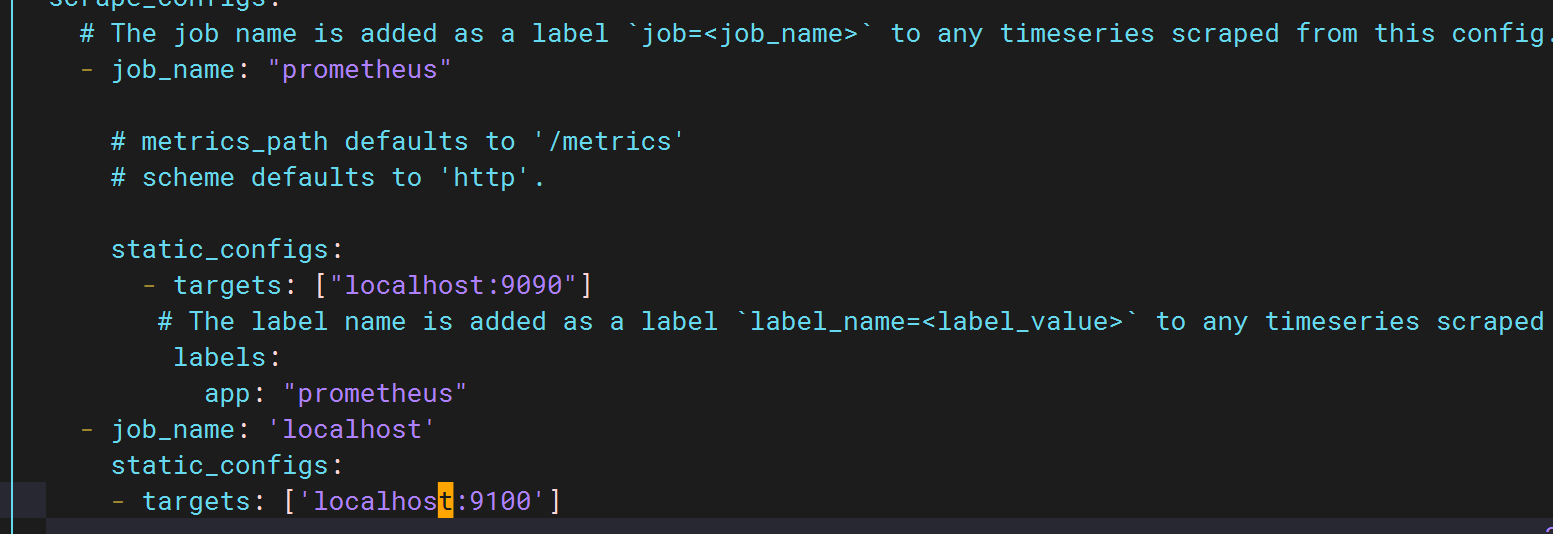
修改好prometheus.yml文件后重启prometheus
启用prometheus
先杀死prometheus进程
[root@prometheus prometheus]# killall prometheus
[root@prometheus prometheus]# netstat -anptu | grep prometheus
[root@prometheus prometheus]# nohup prometheus --config.file=/usr/local/prometheus/prometheus.yml &
[3] 14740
[root@prometheus prometheus]# nohup: 忽略输入并把输出追加到 'nohup.out'
[root@prometheus prometheus]# 在哪儿运行nohup.out就会输出到哪儿
[root@prometheus prometheus]# ls
data  LICENSE  nohup.out  NOTICE  prometheus  prometheus.yml  promtool
访问
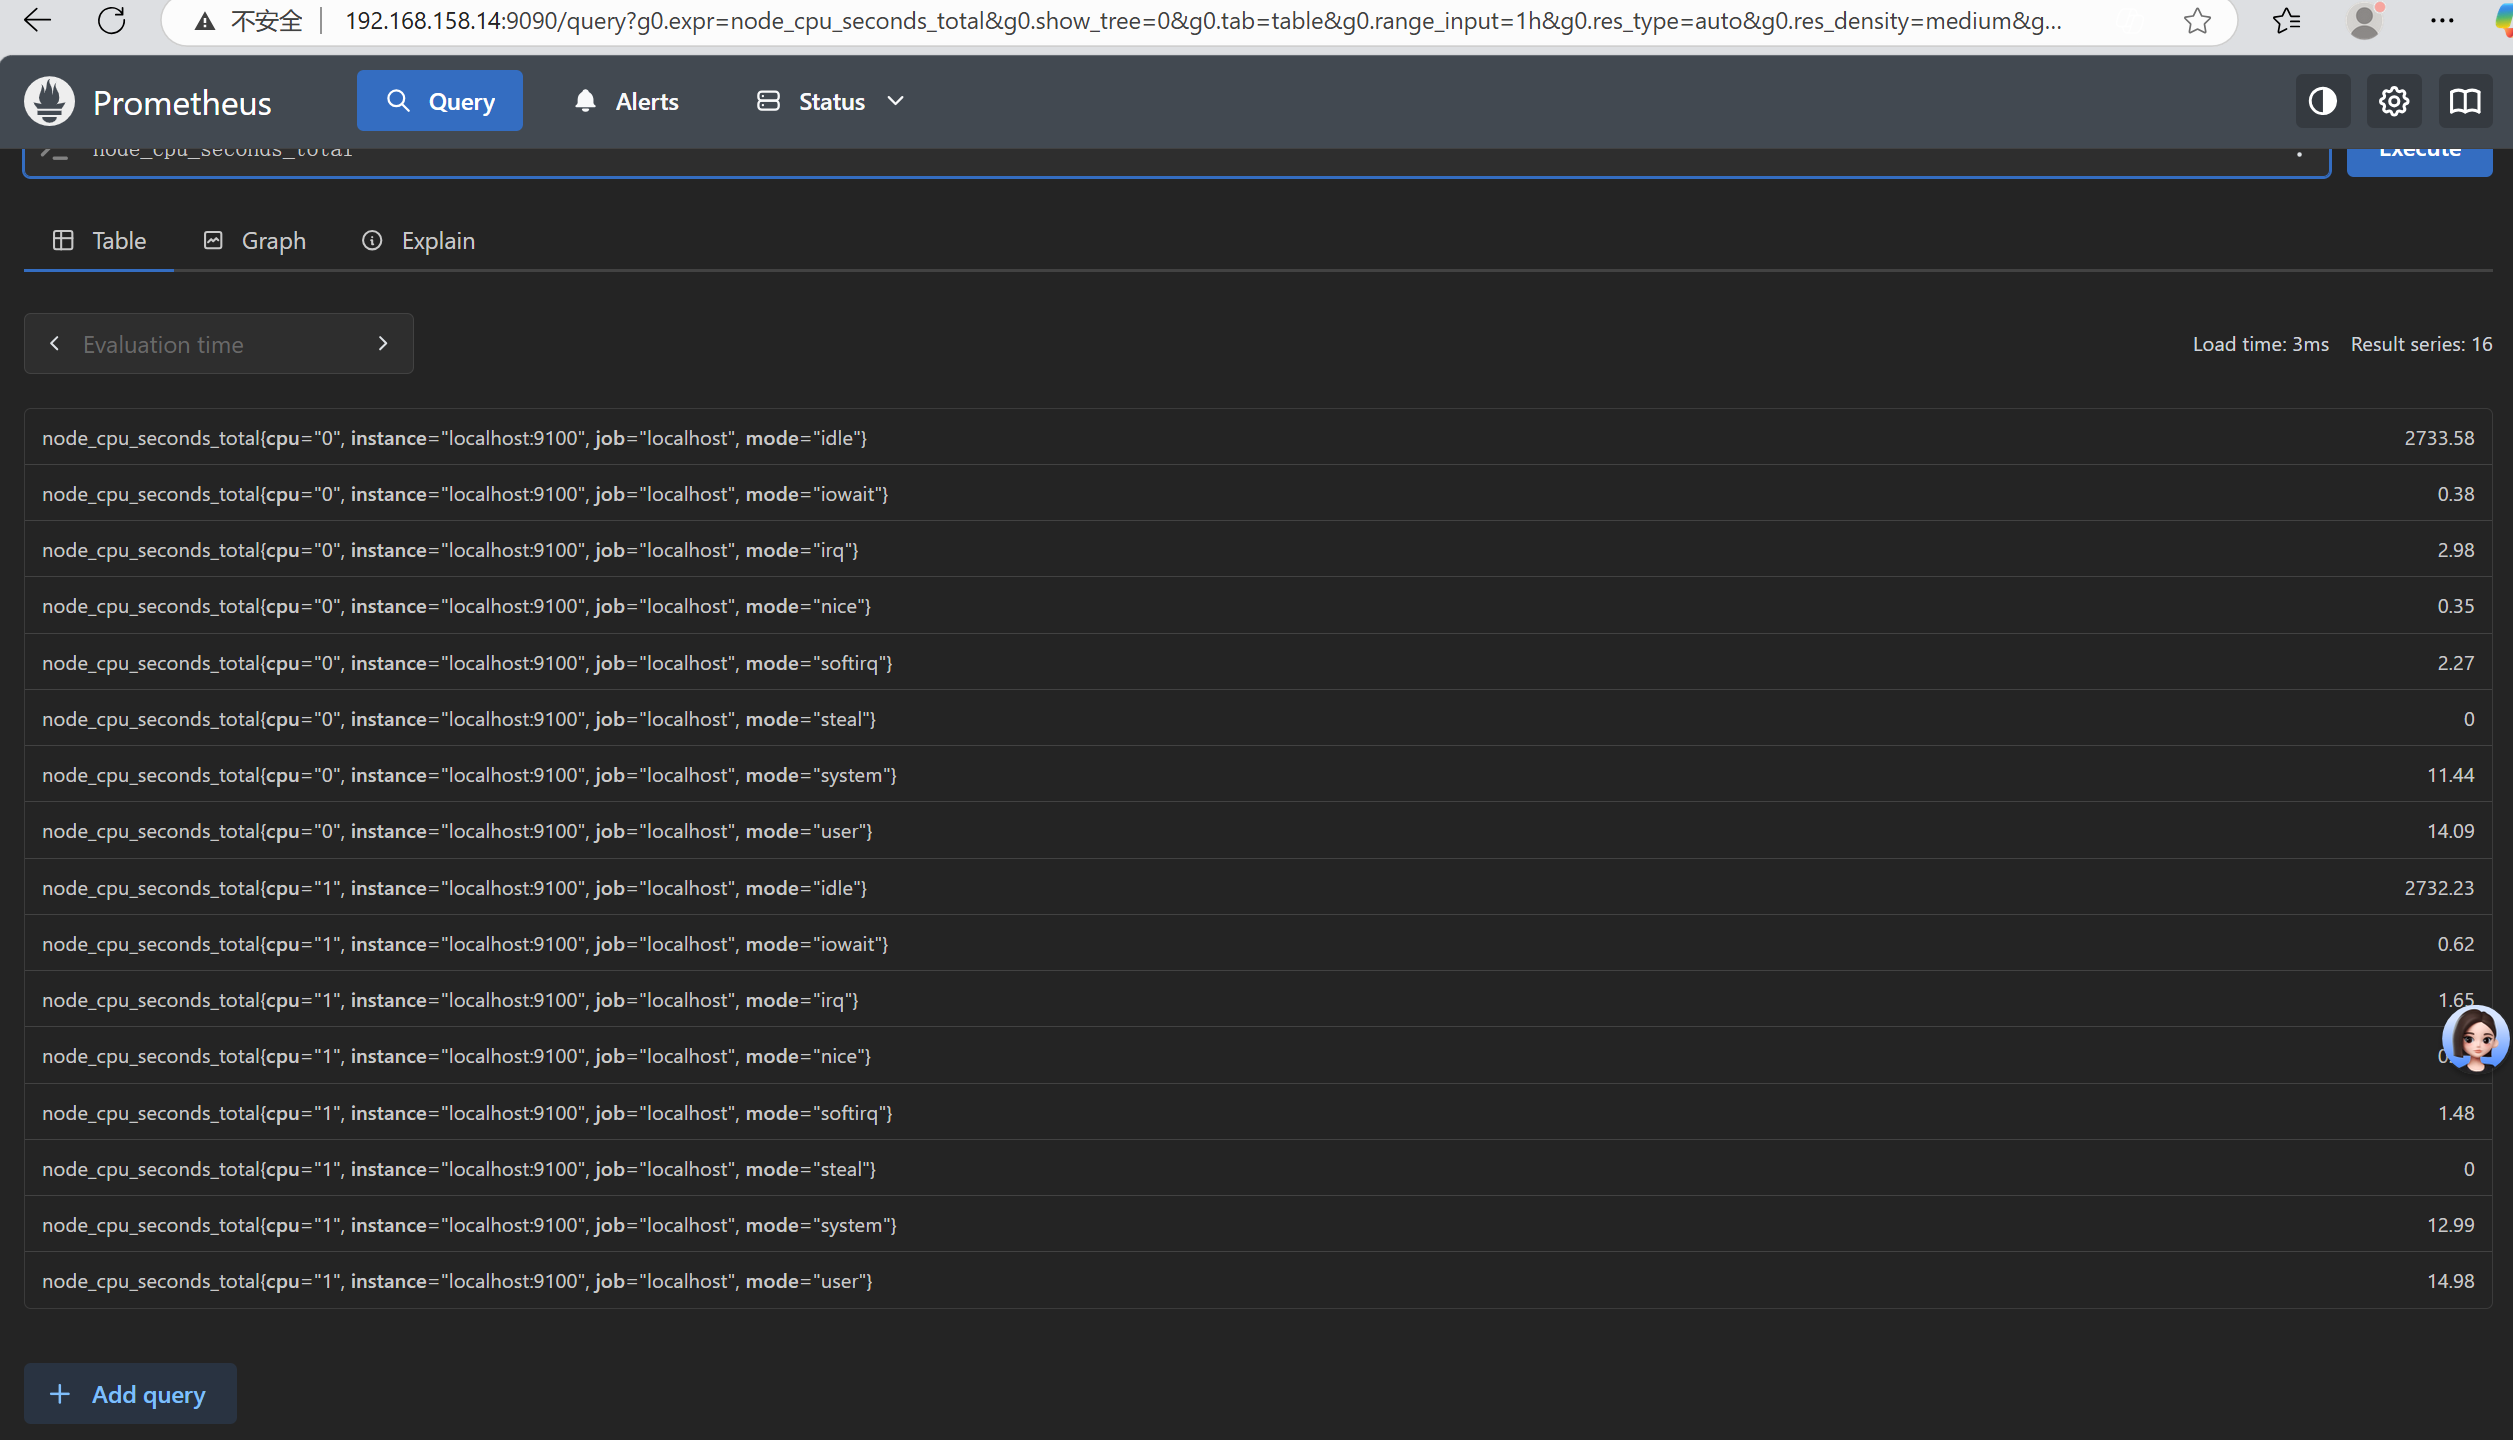
192.168.158.14:9090
这里可以输入一个cpu测试一下数据采集,然后Execute执行
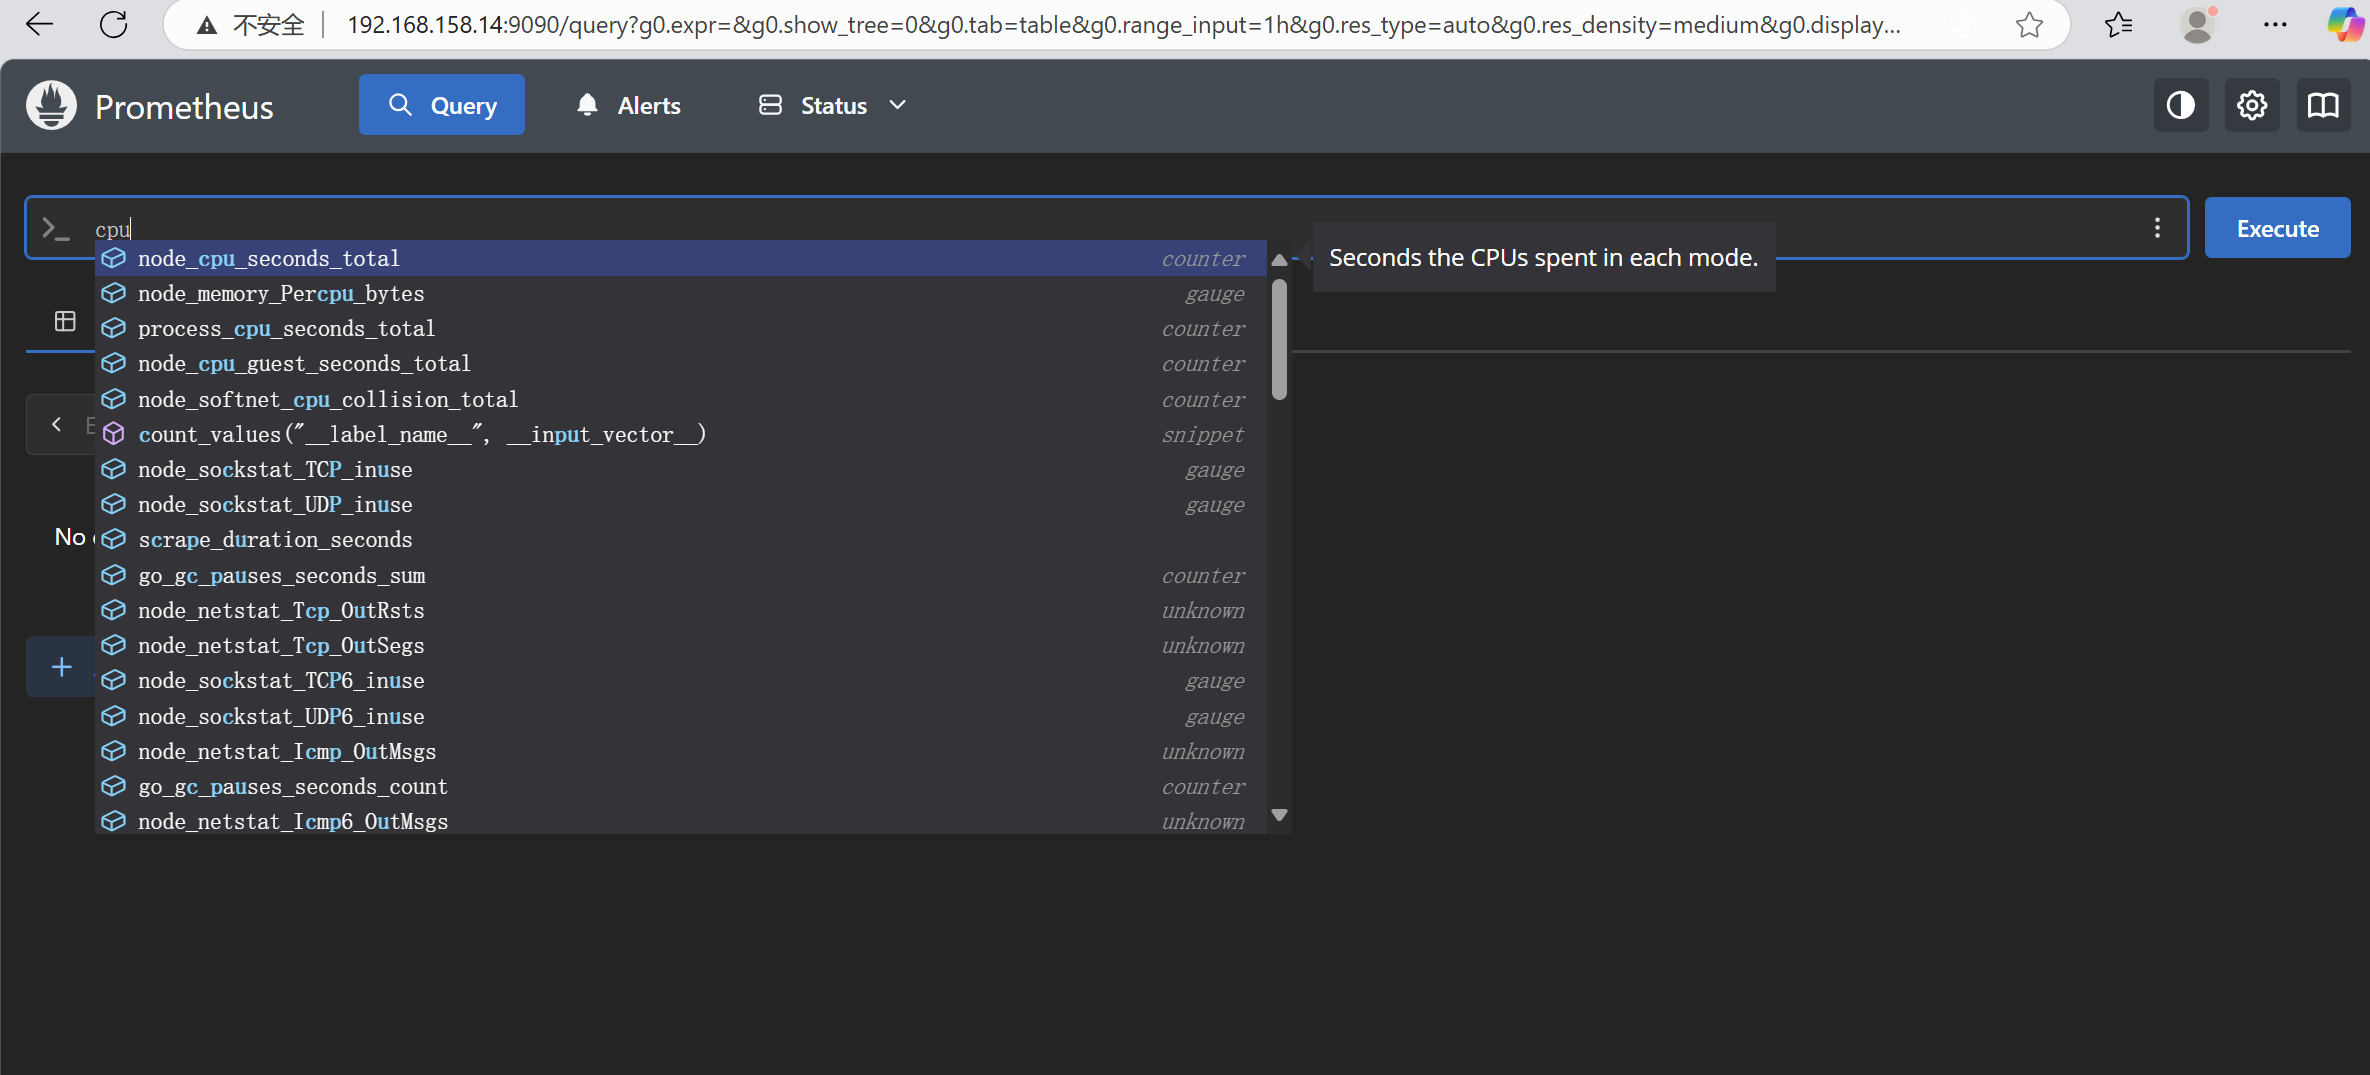
下面是它采集的数据
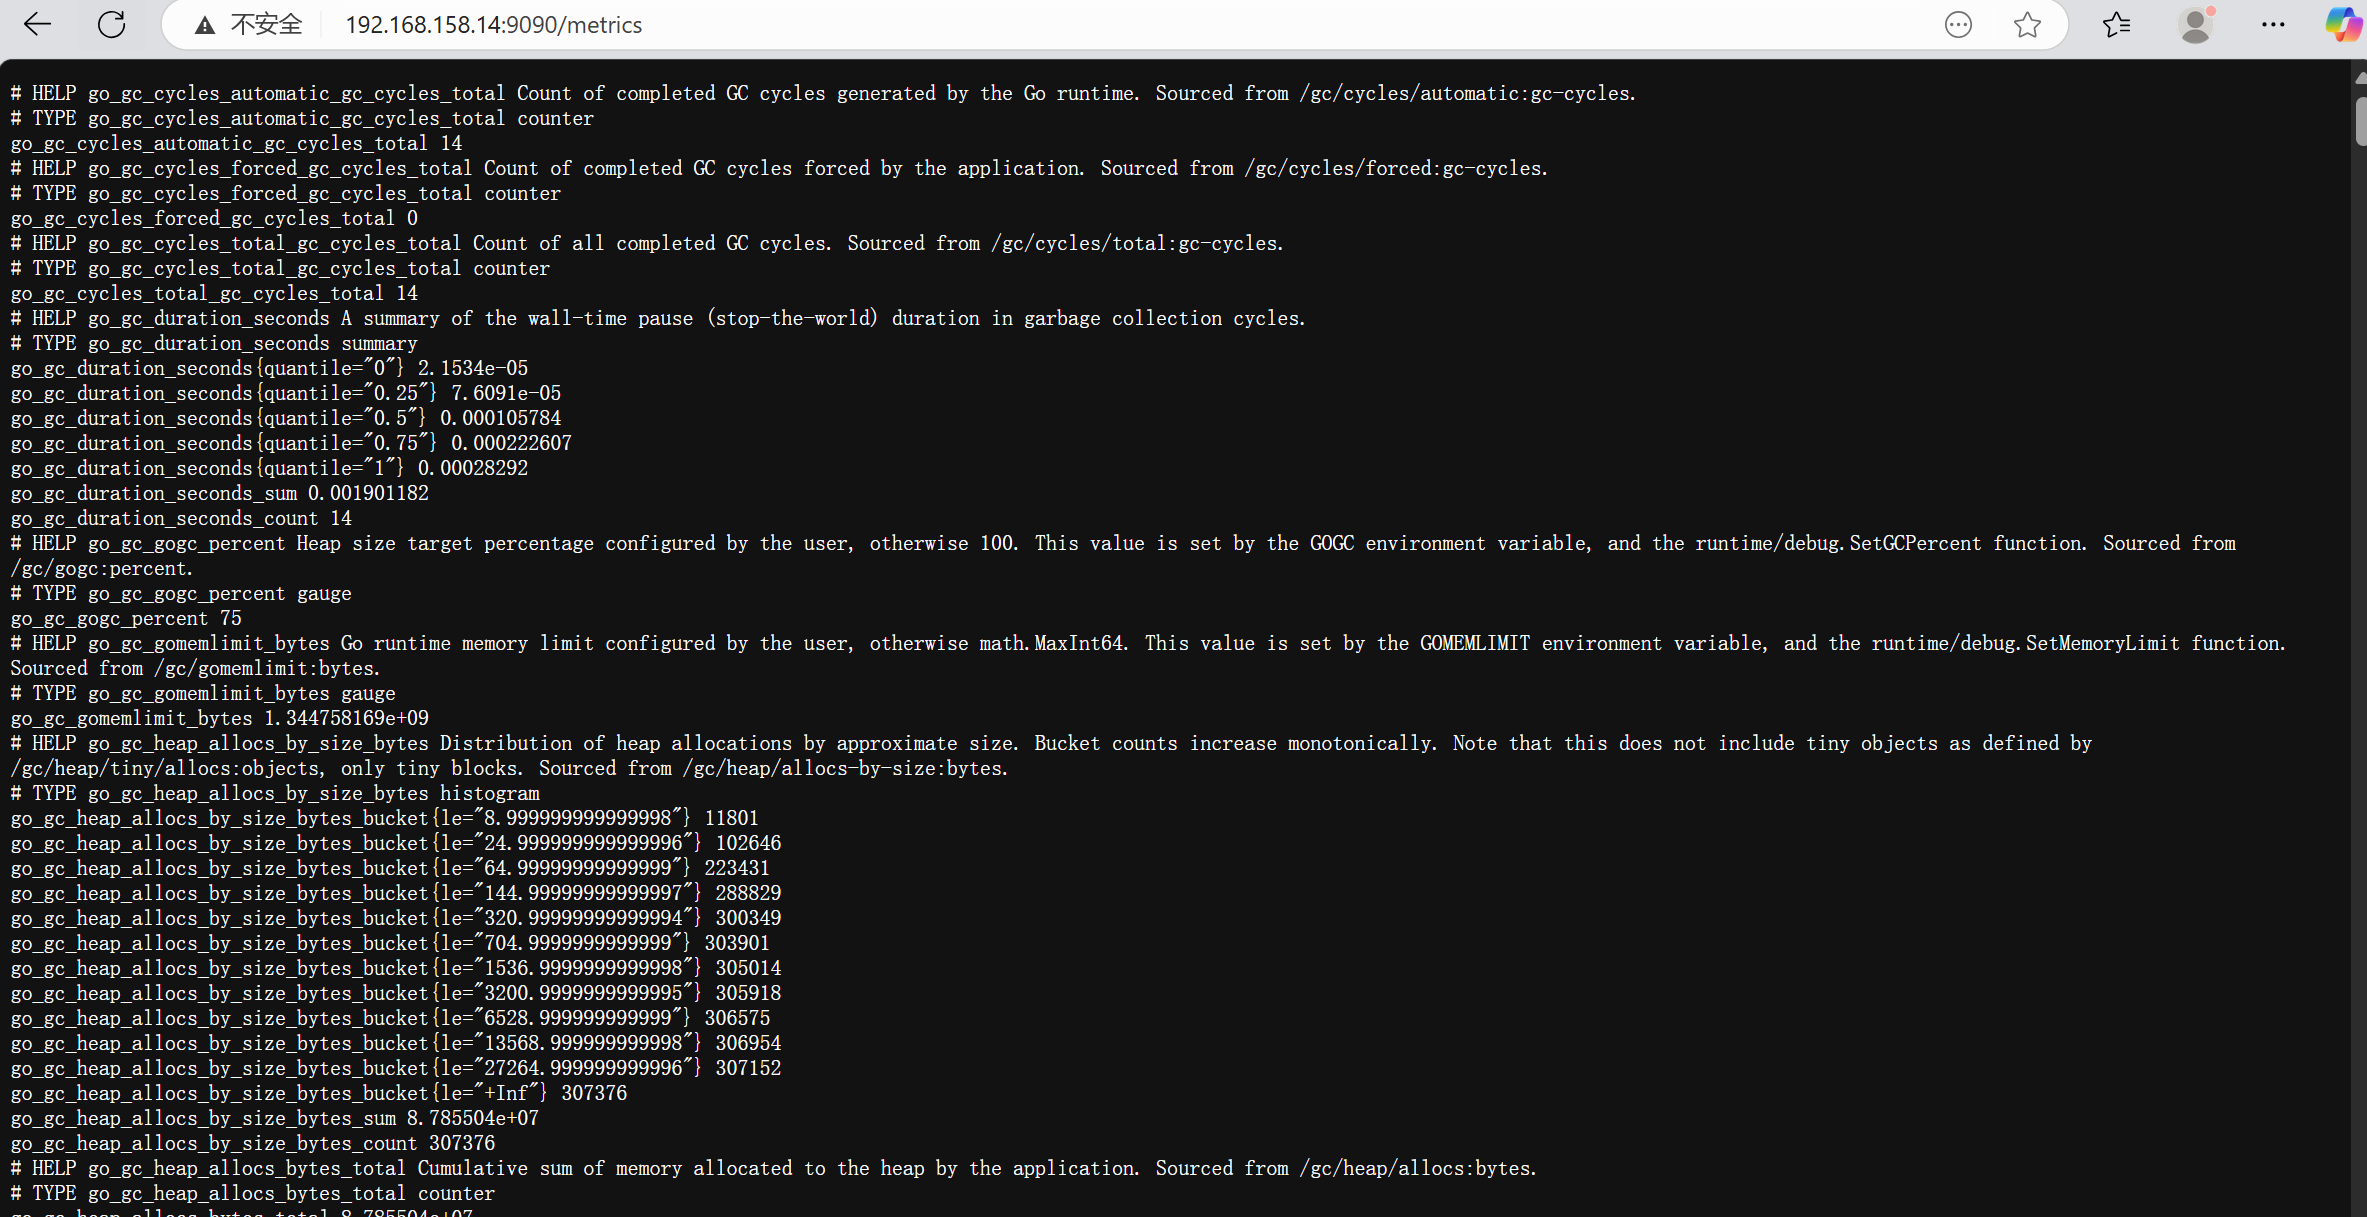
查看prometheus采集所有指标
192.168.158.14:9090/metrics
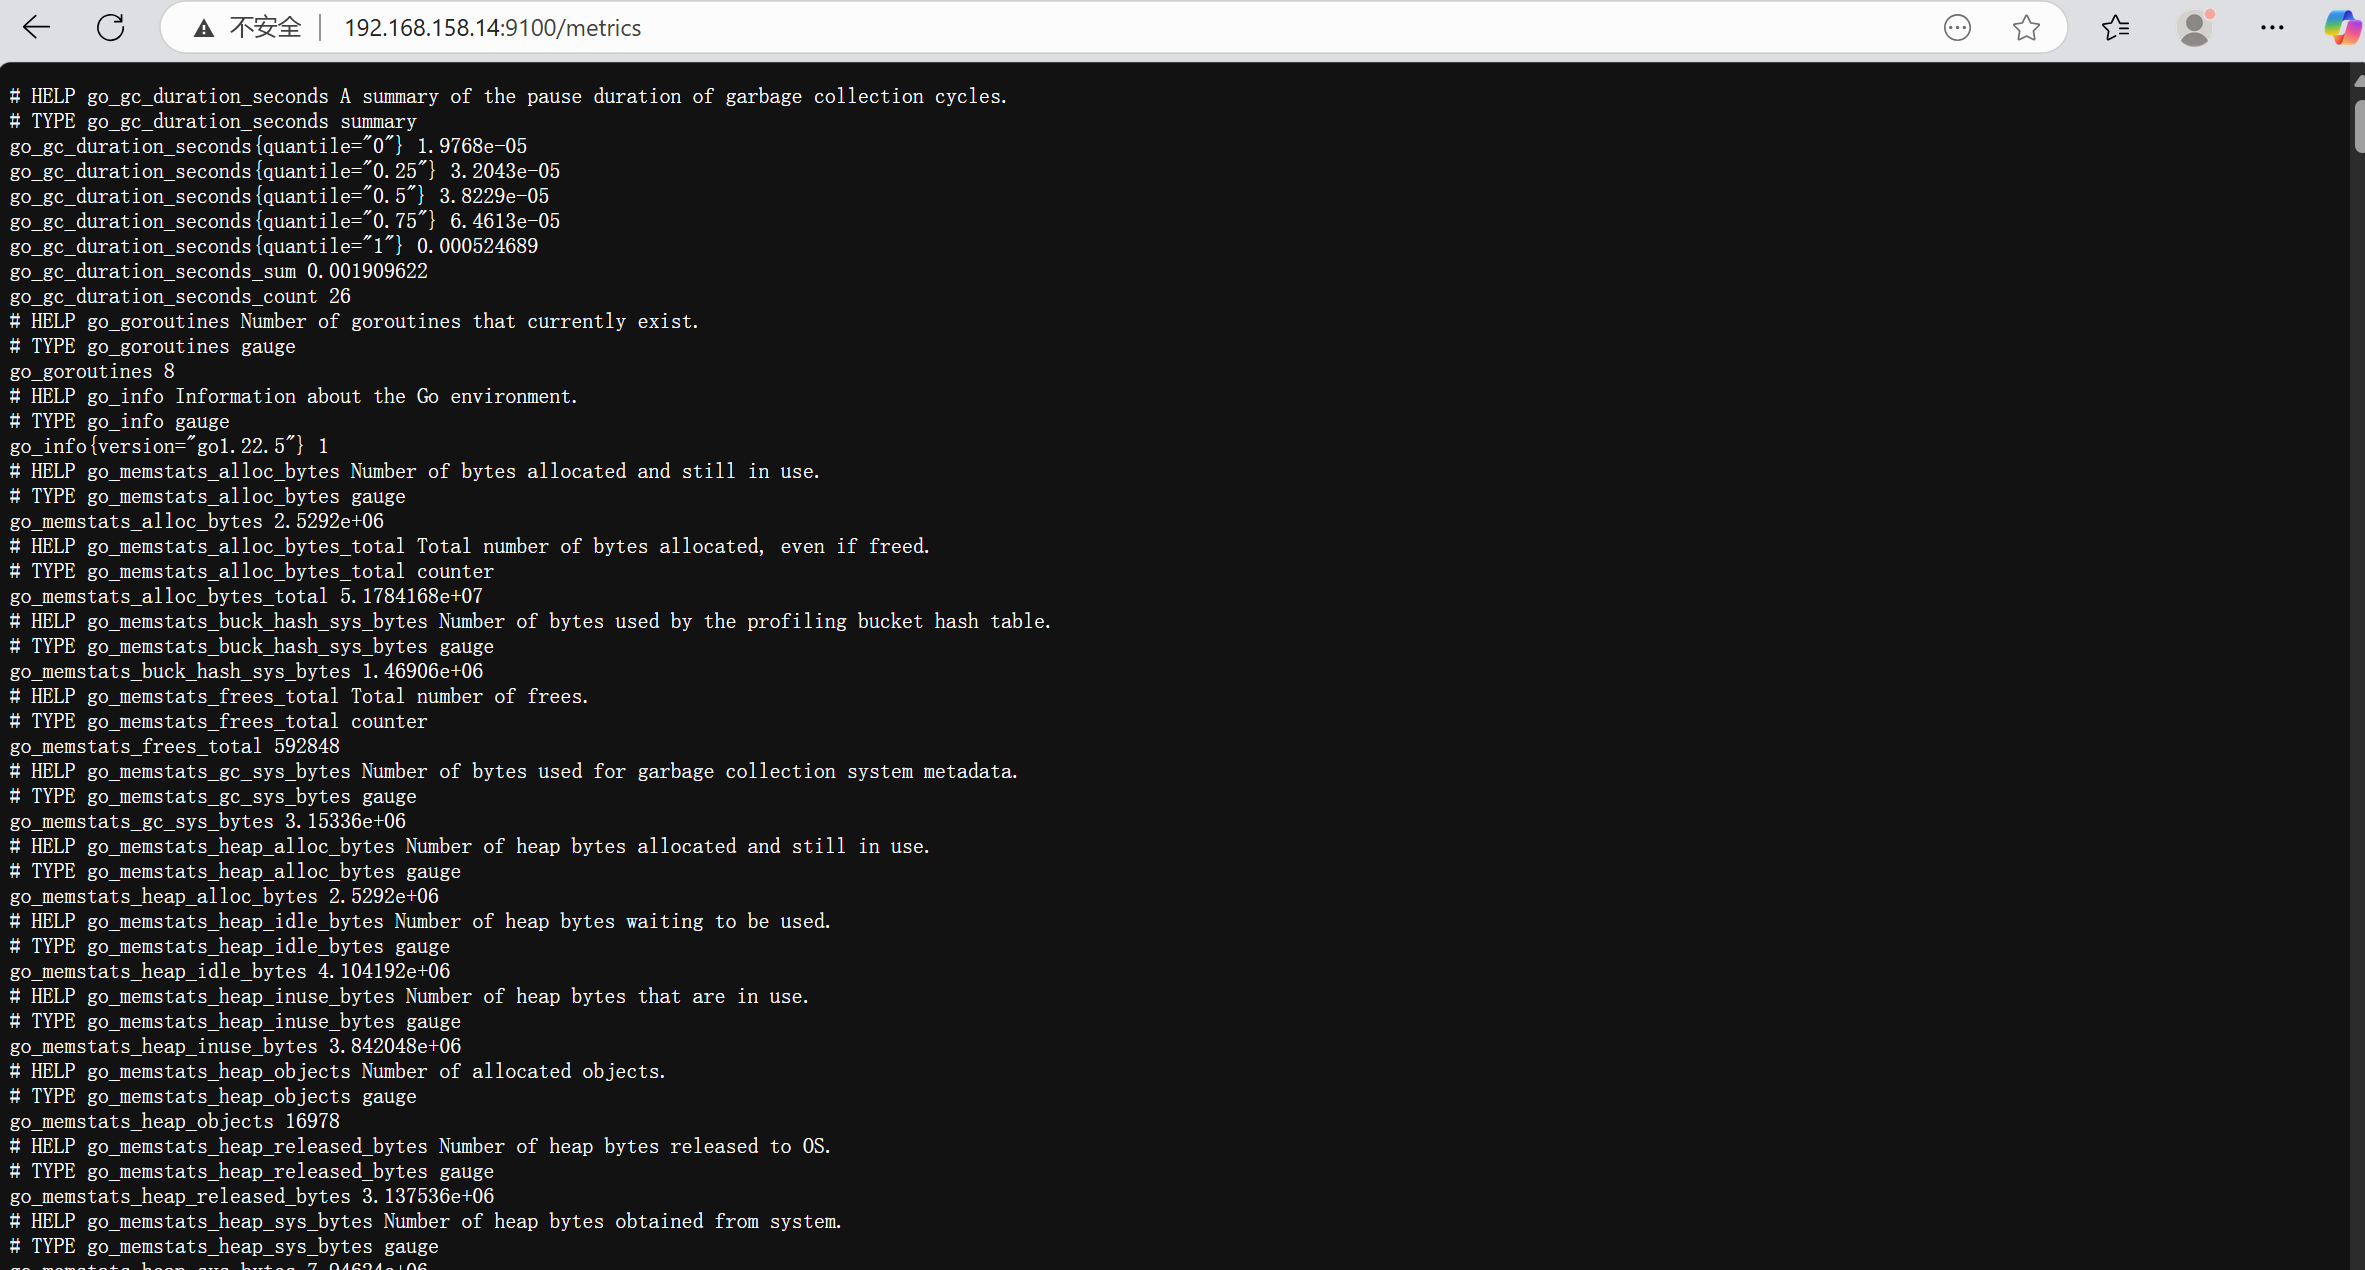
查看exporter采集的指标数据
192.168.158.14:9100/metrics
部署grafana
[root@prometheus ~]# ls
alertmanager-0.28.1.linux-amd64.tar.gz node_exporter-1.8.2.linux-amd64.tar.gz
anaconda-ks.cfg nohup.out
data prometheus-3.3.0.linux-amd64.tar.gz
grafana-enterprise-11.6.0-1.x86_64.rpm
安装grafana
[root@prometheus ~]# rpm -ivh grafana-enterprise-11.6.0-1.x86_64.rpm
警告:grafana-enterprise-11.6.0-1.x86_64.rpm: 头 V4 RSA/SHA512 Signature, 密钥 ID 10458545: NOKEY
Verifying... ################################# [100%]
准备中... ################################# [100%]
正在升级/安装...
1:grafana-enterprise-11.6.0-1 ################################# [100%]
### NOT starting on installation, please execute the following statements to configure grafana to start automatically using systemd
sudo /bin/systemctl daemon-reload
sudo /bin/systemctl enable grafana-server.service
### You can start grafana-server by executing
sudo /bin/systemctl start grafana-server.service
POSTTRANS: Running script
启用grafana
[root@prometheus ~]# systemctl daemon-reload
[root@prometheus ~]# systemctl enable --now grafana-server.service
Created symlink /etc/systemd/system/multi-user.target.wants/grafana-server.service → /usr/lib/systemd/system/grafana-server.service.
查看grafana监听端口,grafana监听端口是3000
[root@prometheus ~]# netstat -anptu | grep grafana
tcp 0 0 192.168.158.14:45316 34.120.177.193:443 ESTABLISHED 19984/grafana
tcp 0 0 192.168.158.14:45348 34.120.177.193:443 ESTABLISHED 19984/grafana
tcp 0 0 192.168.158.14:45330 34.120.177.193:443 ESTABLISHED 19984/grafana
tcp 0 0 192.168.158.14:45356 34.120.177.193:443 ESTABLISHED 19984/grafana
tcp 0 0 192.168.158.14:45352 34.120.177.193:443 ESTABLISHED 19984/grafana
tcp 0 0 192.168.158.14:45332 34.120.177.193:443 ESTABLISHED 19984/grafana
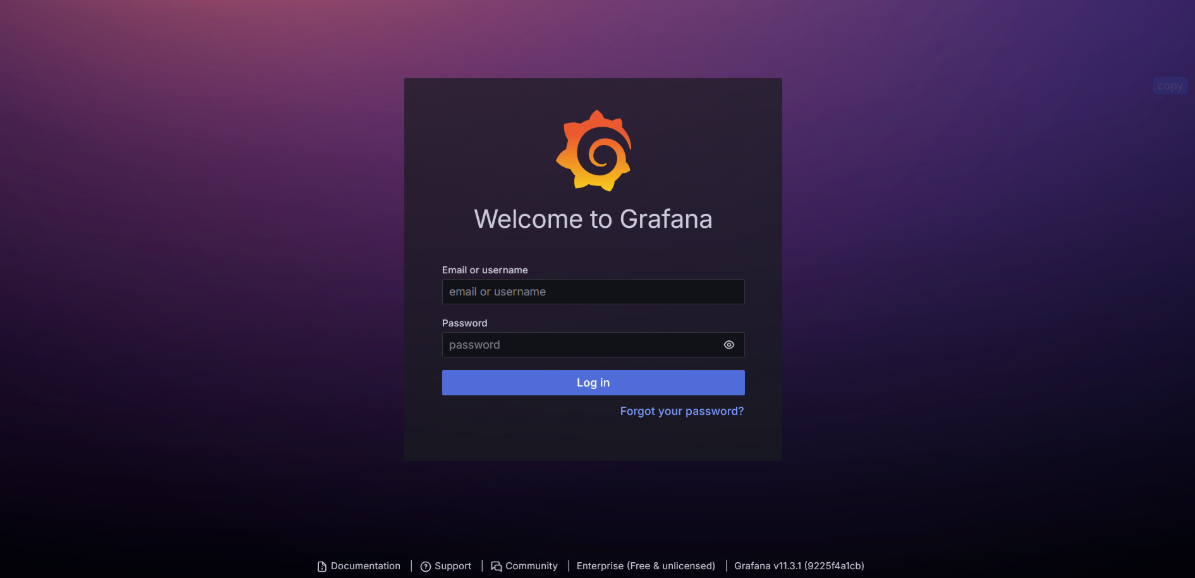
tcp6 0 0 :::3000 :::* LISTEN 19984/grafana访问页面
grafana启动成功后,可以通过页面访问到grafana页面
在浏览器中输入http://IP或者域名:3000
用户名和密码
admin/admin
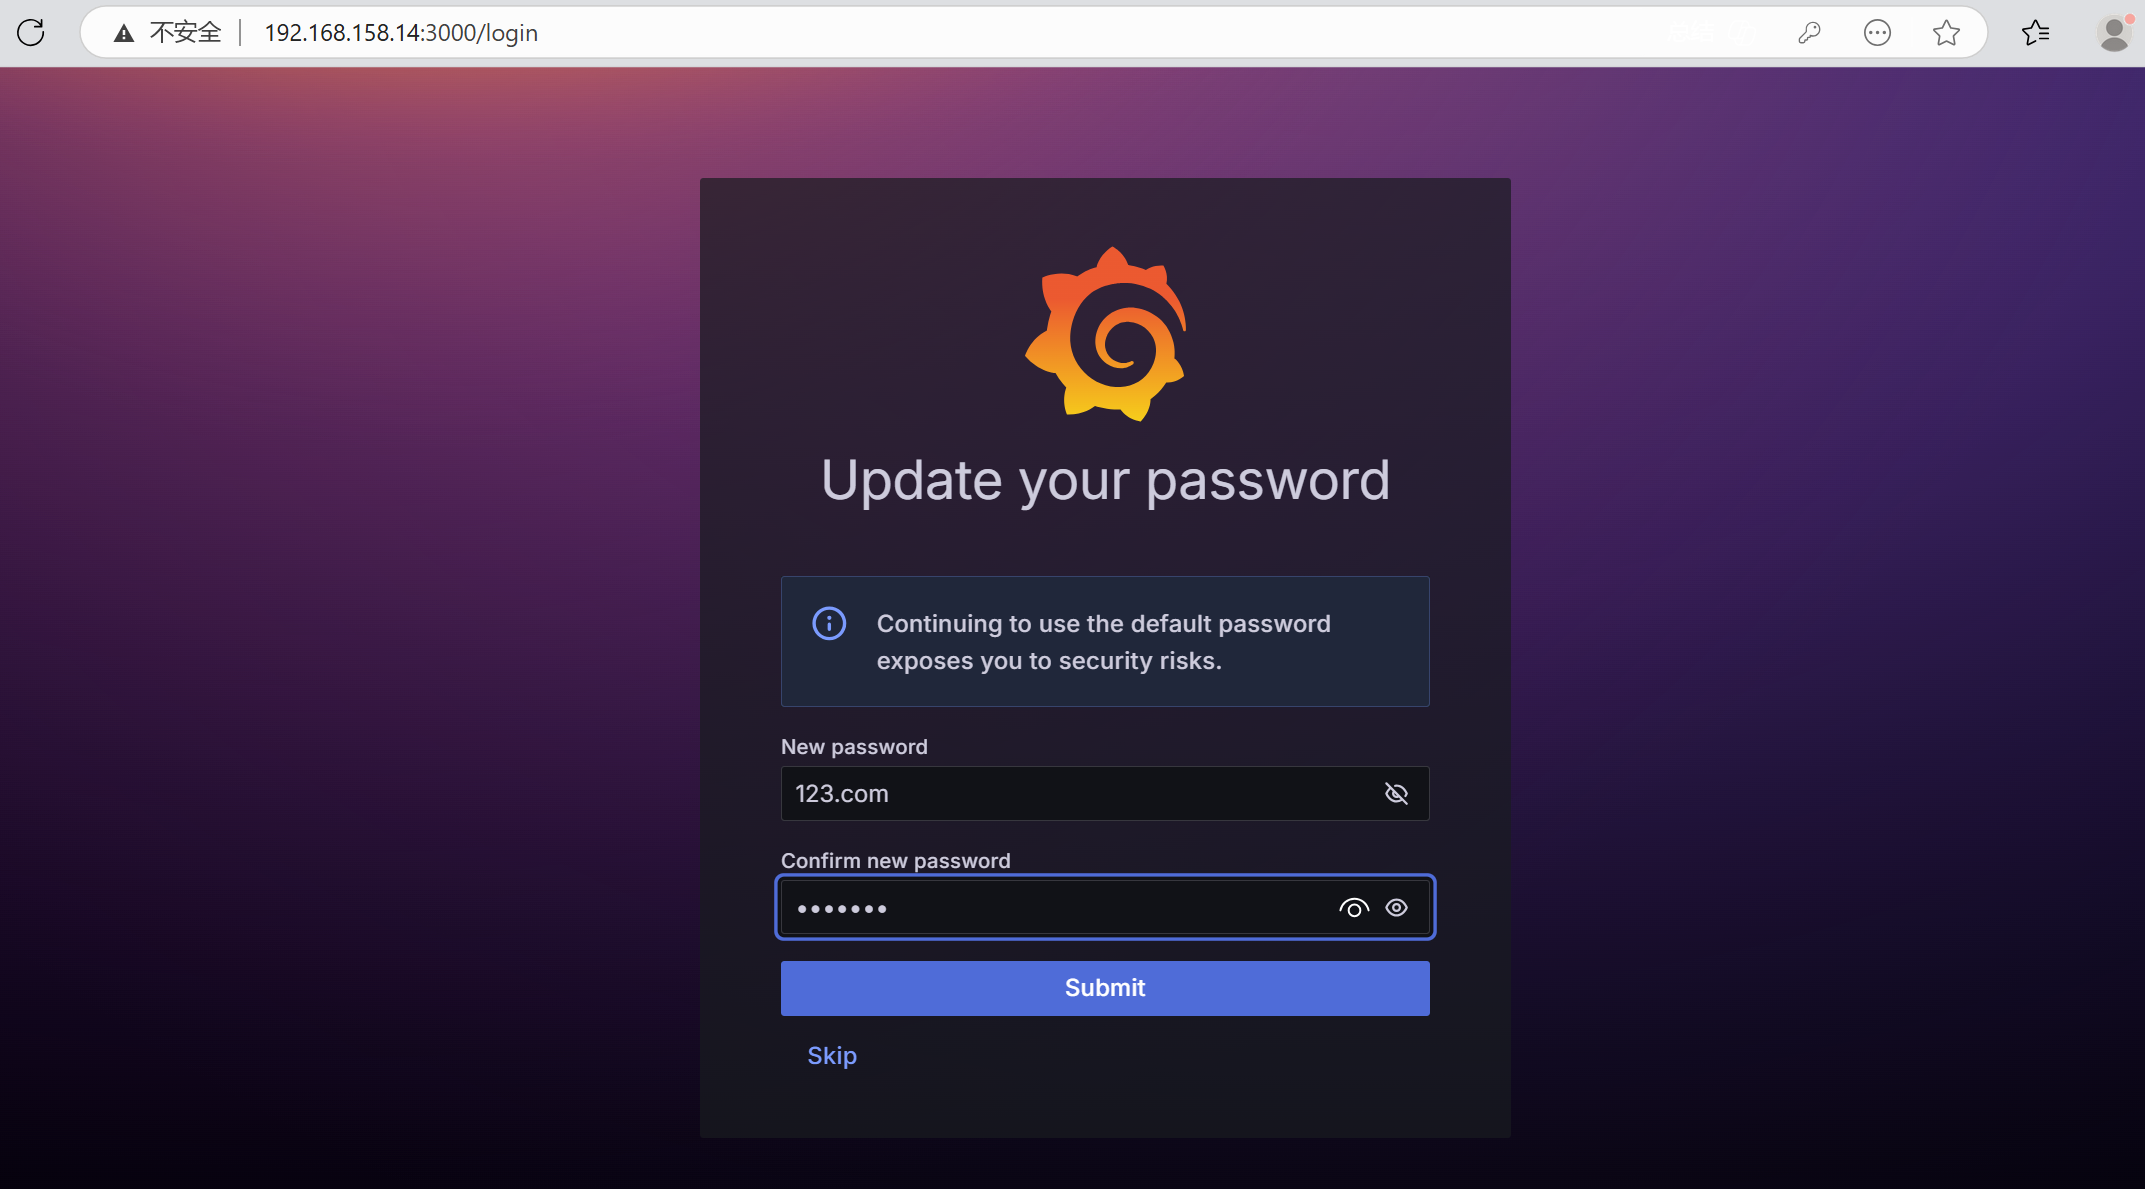
修改密码
123.com
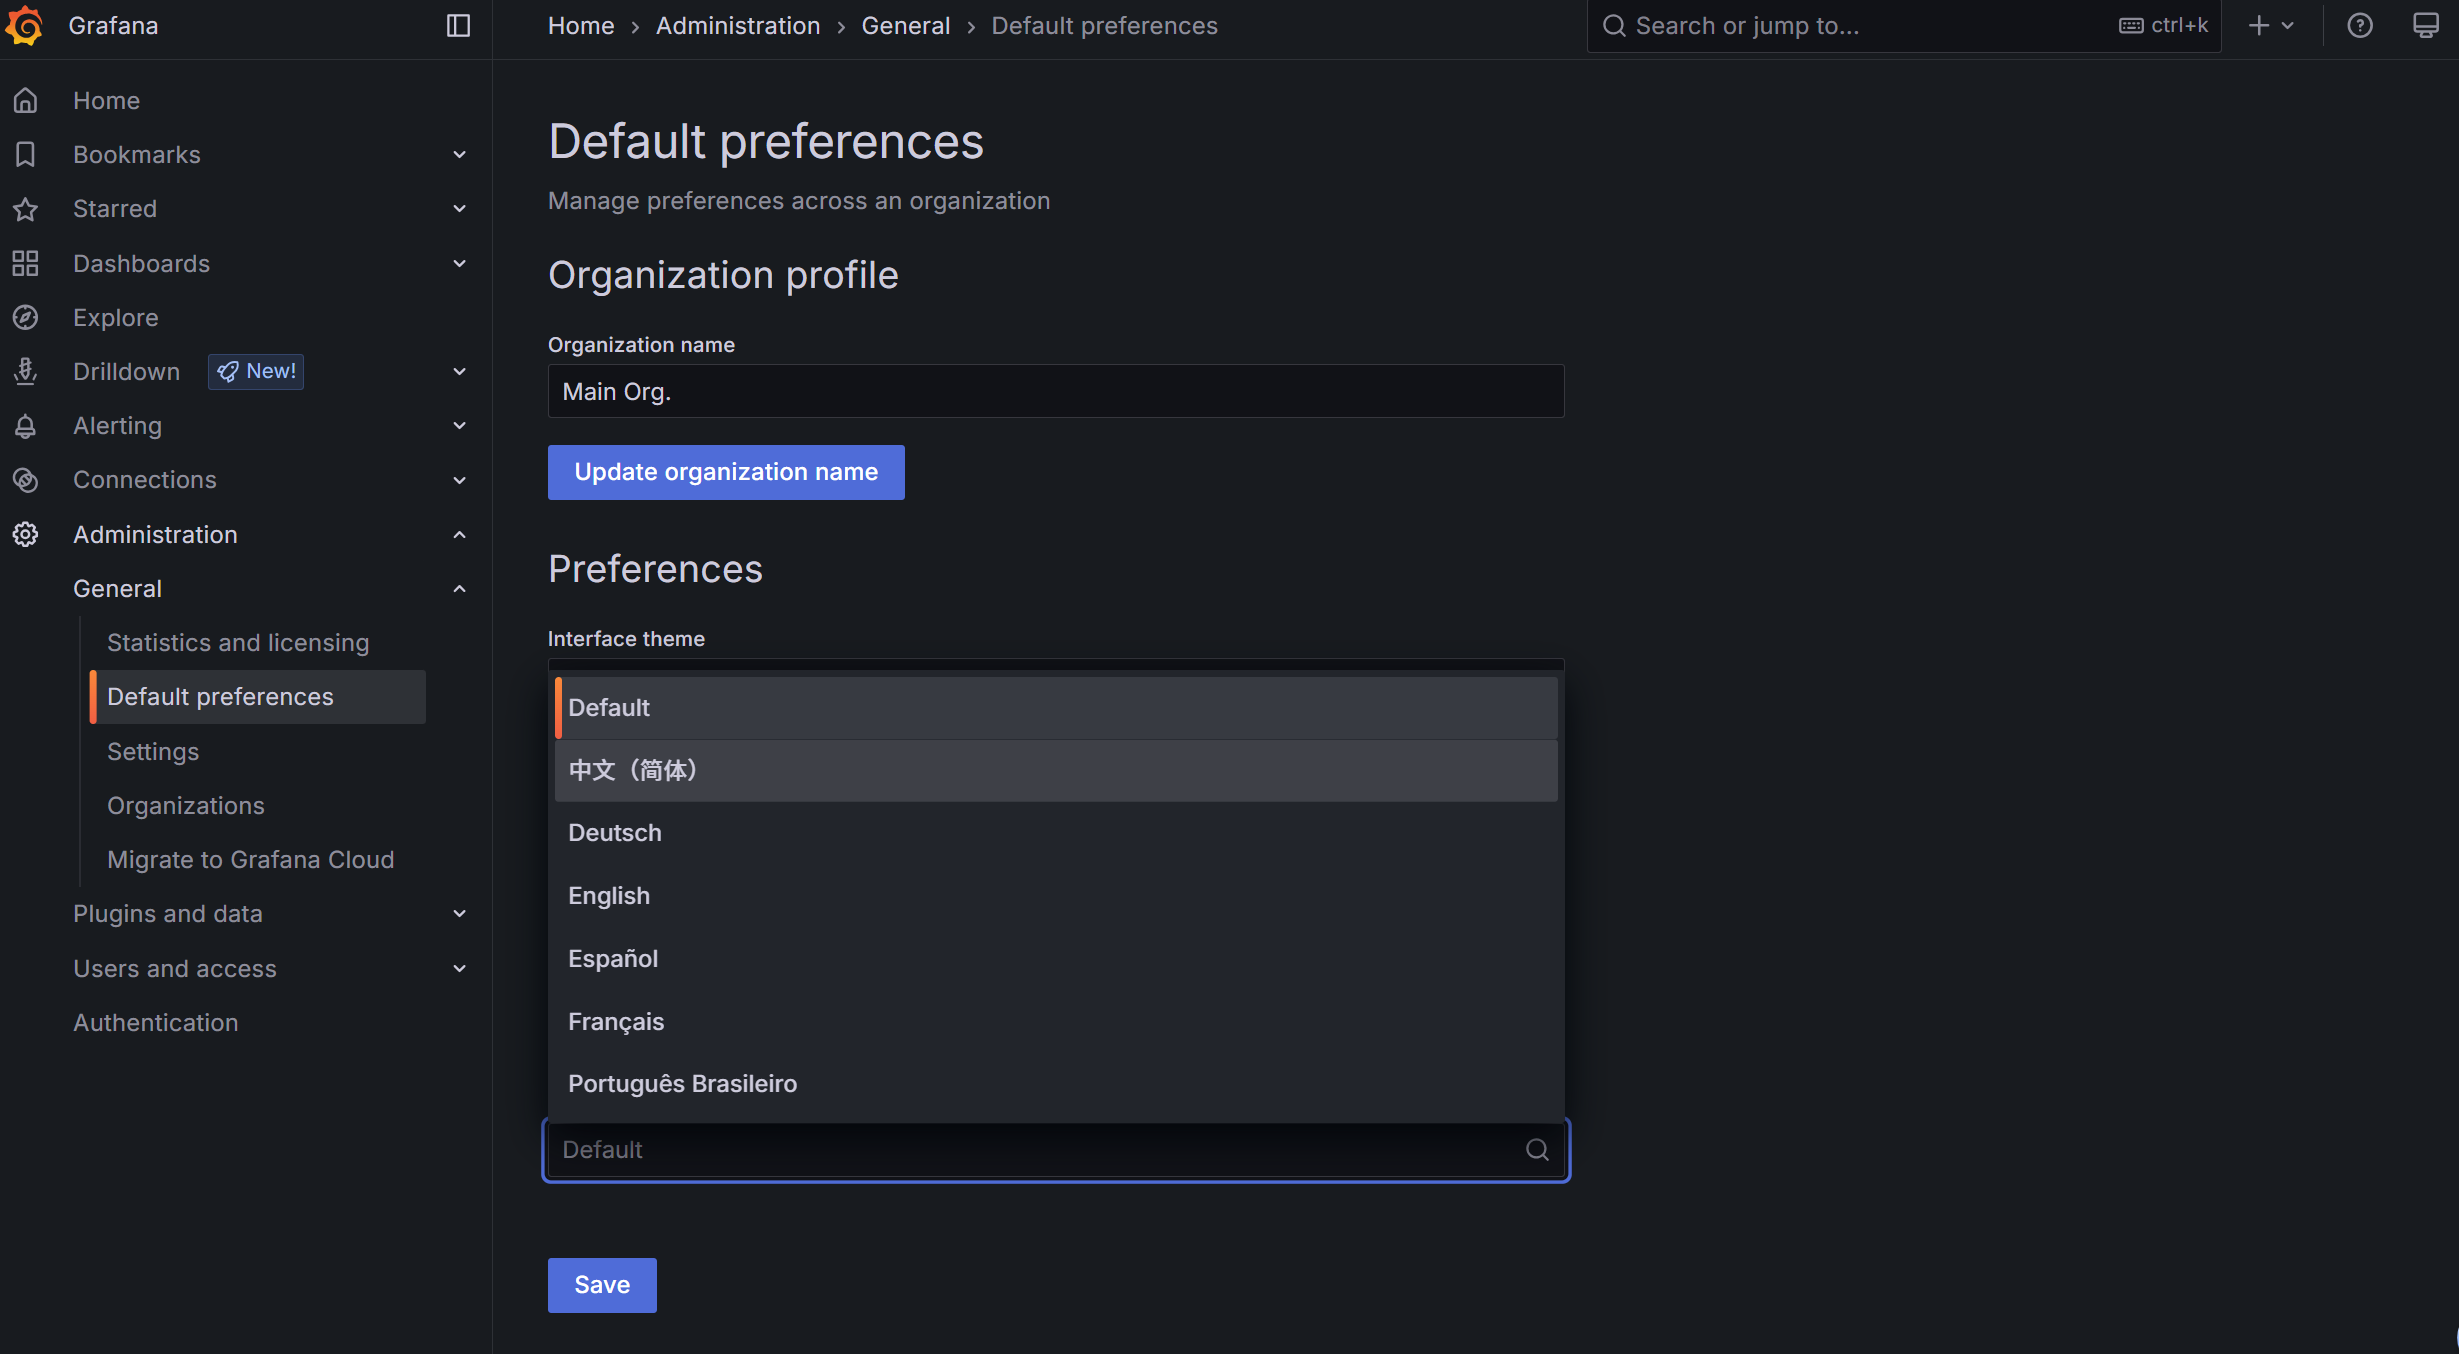
汉化
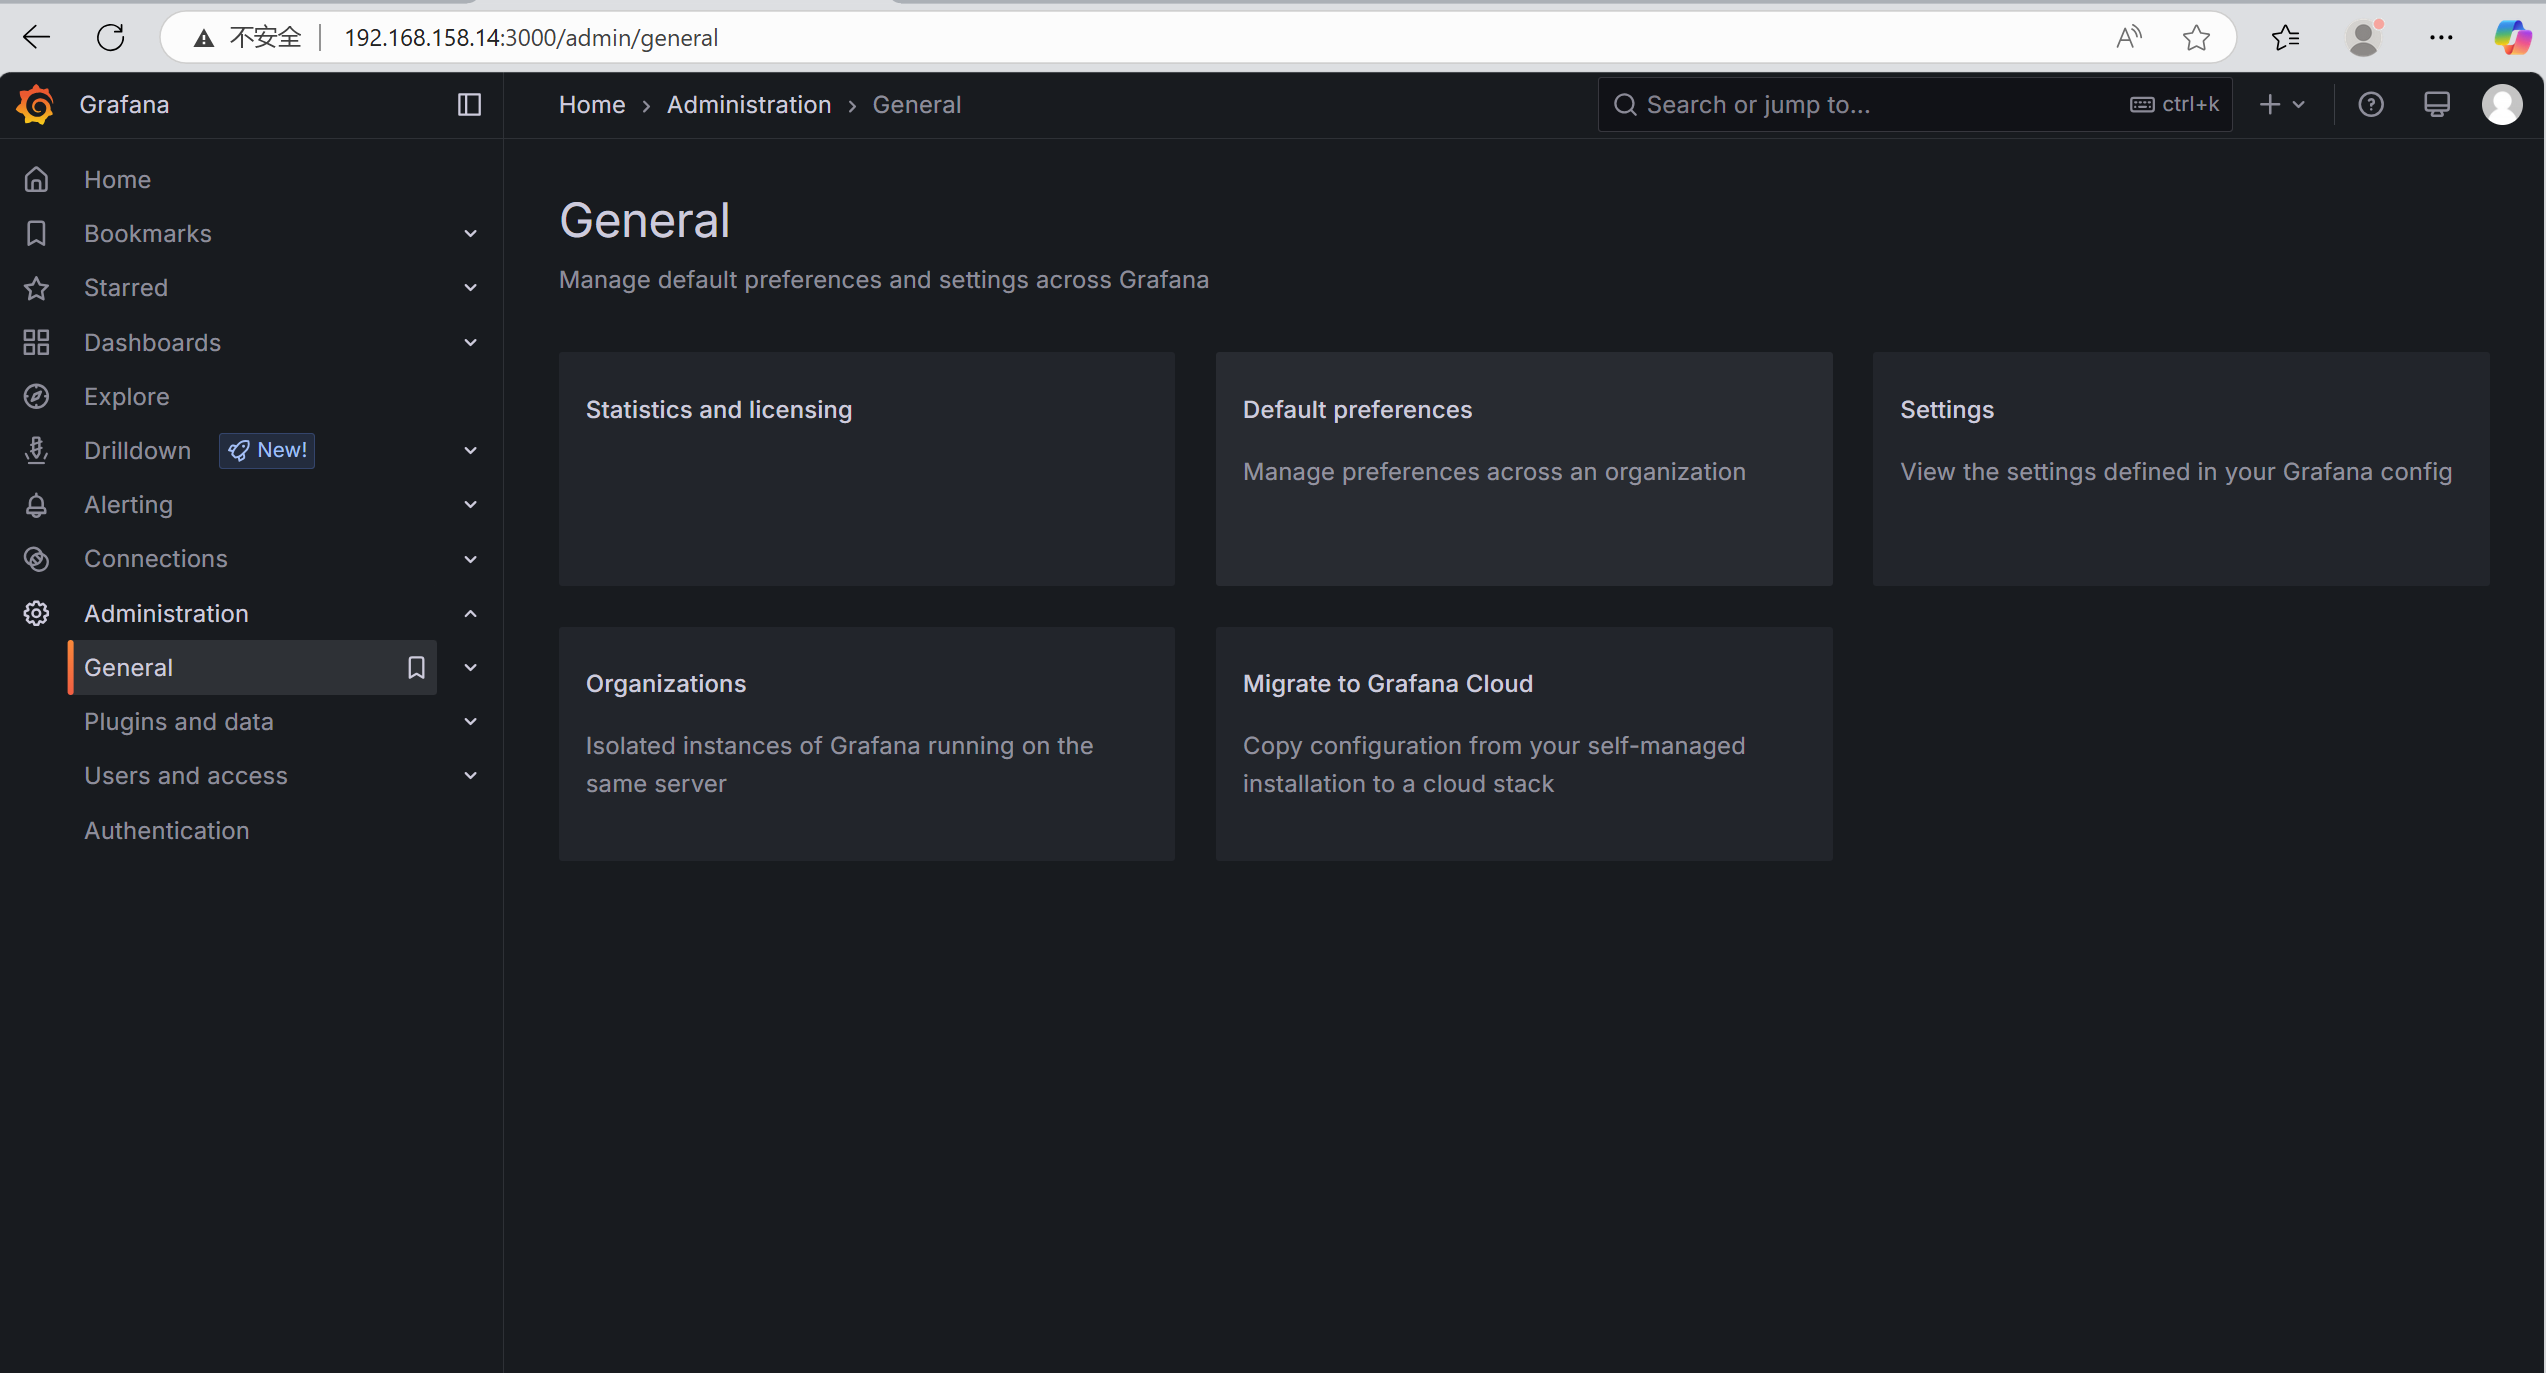
选择中,save保存
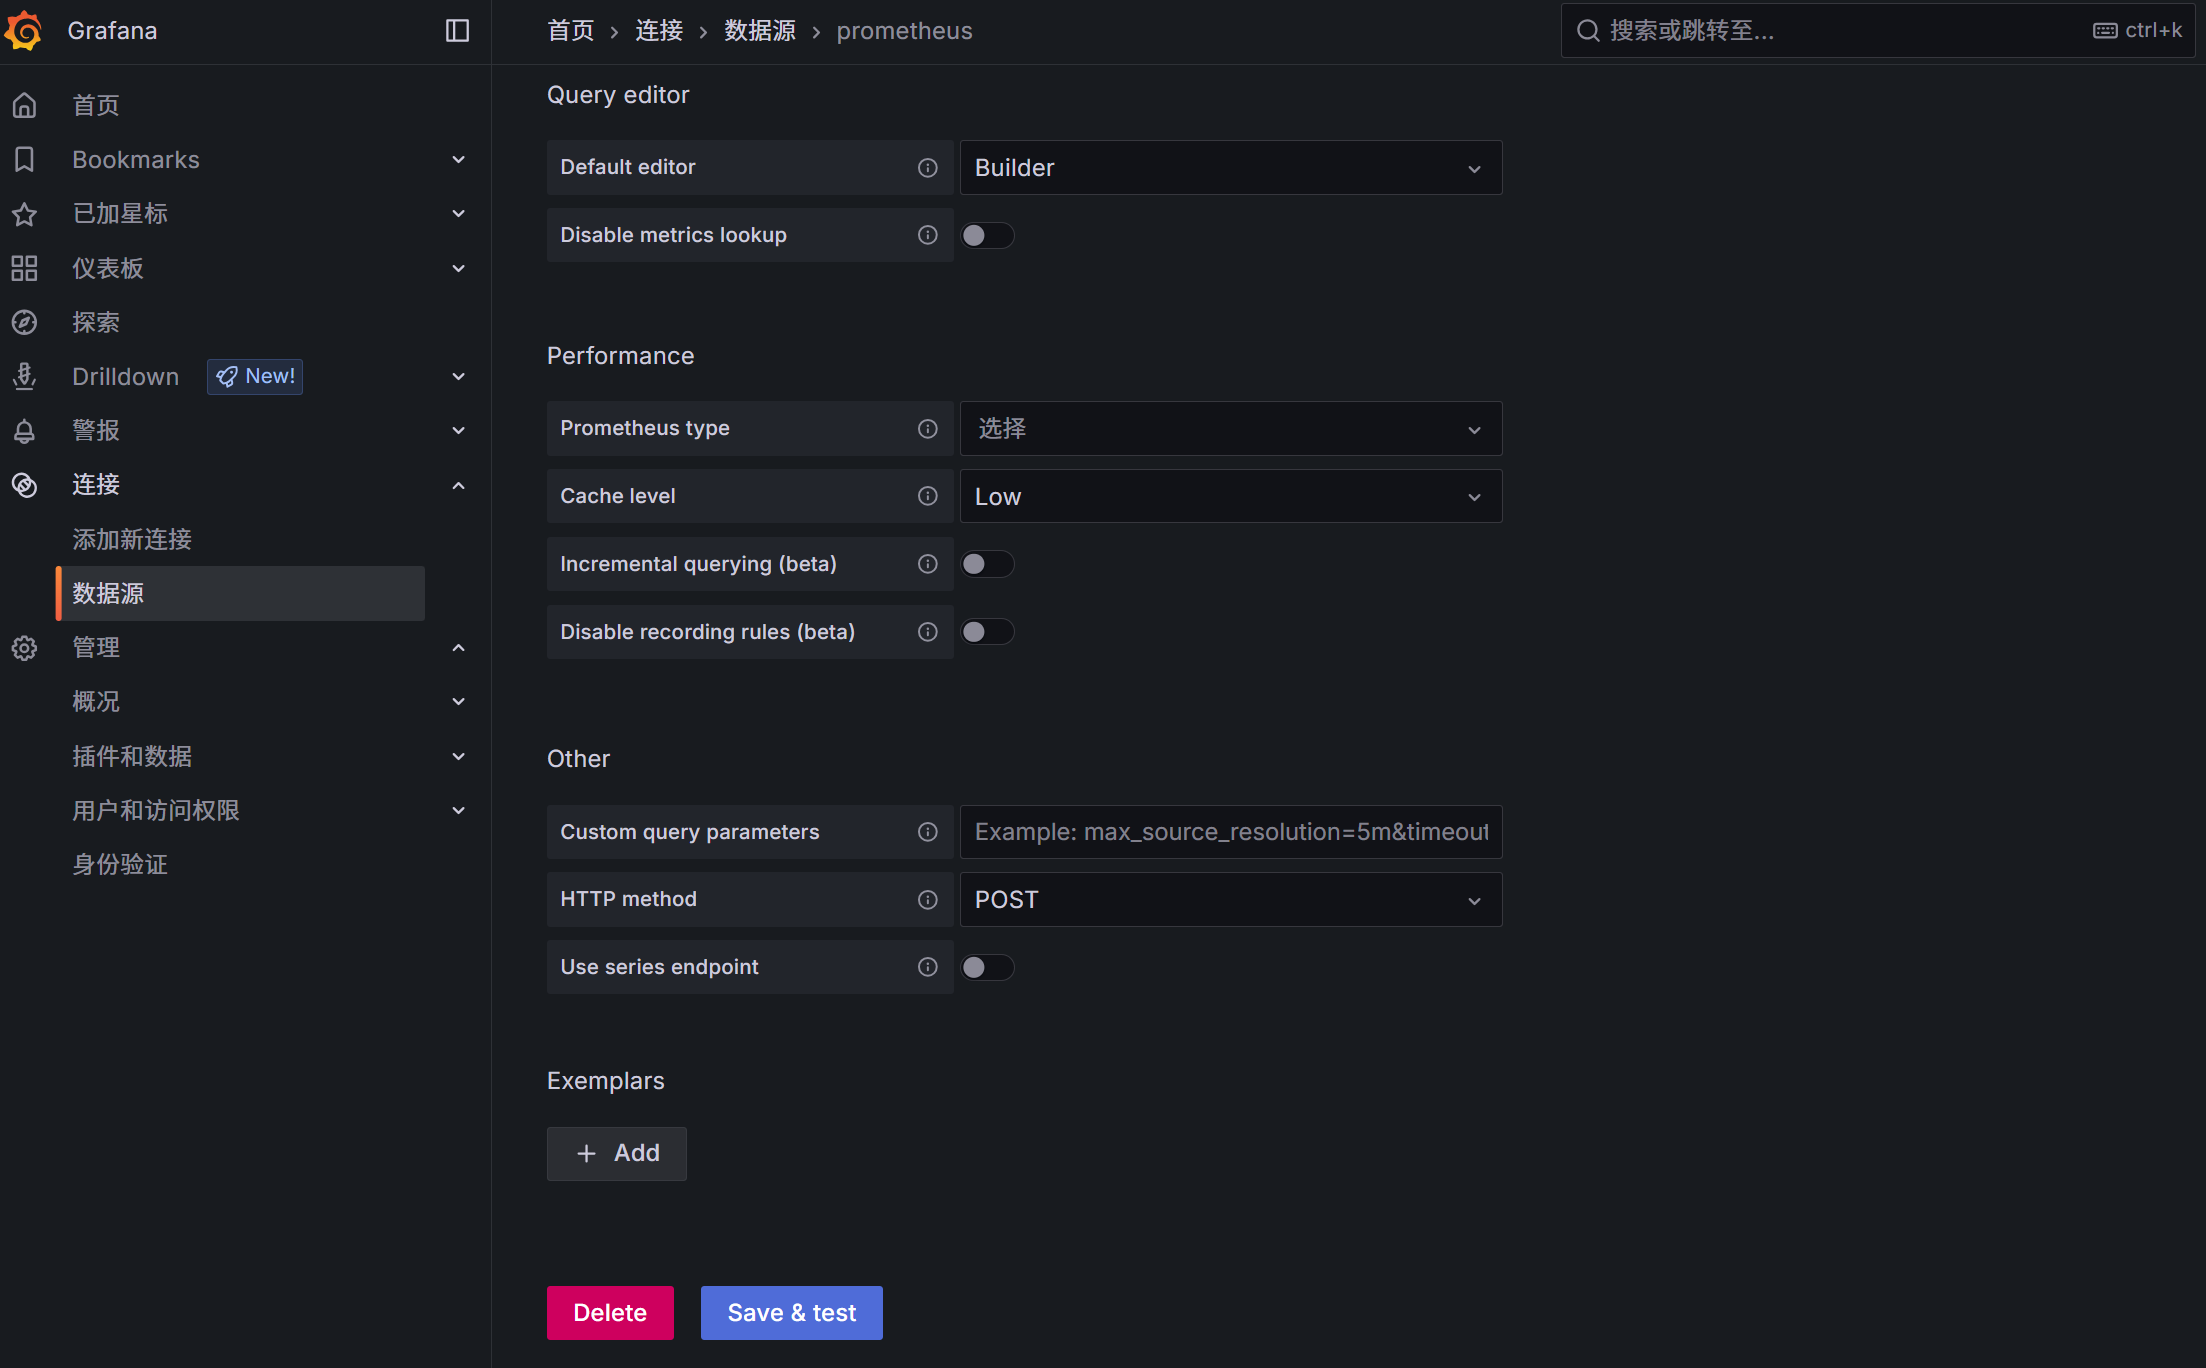
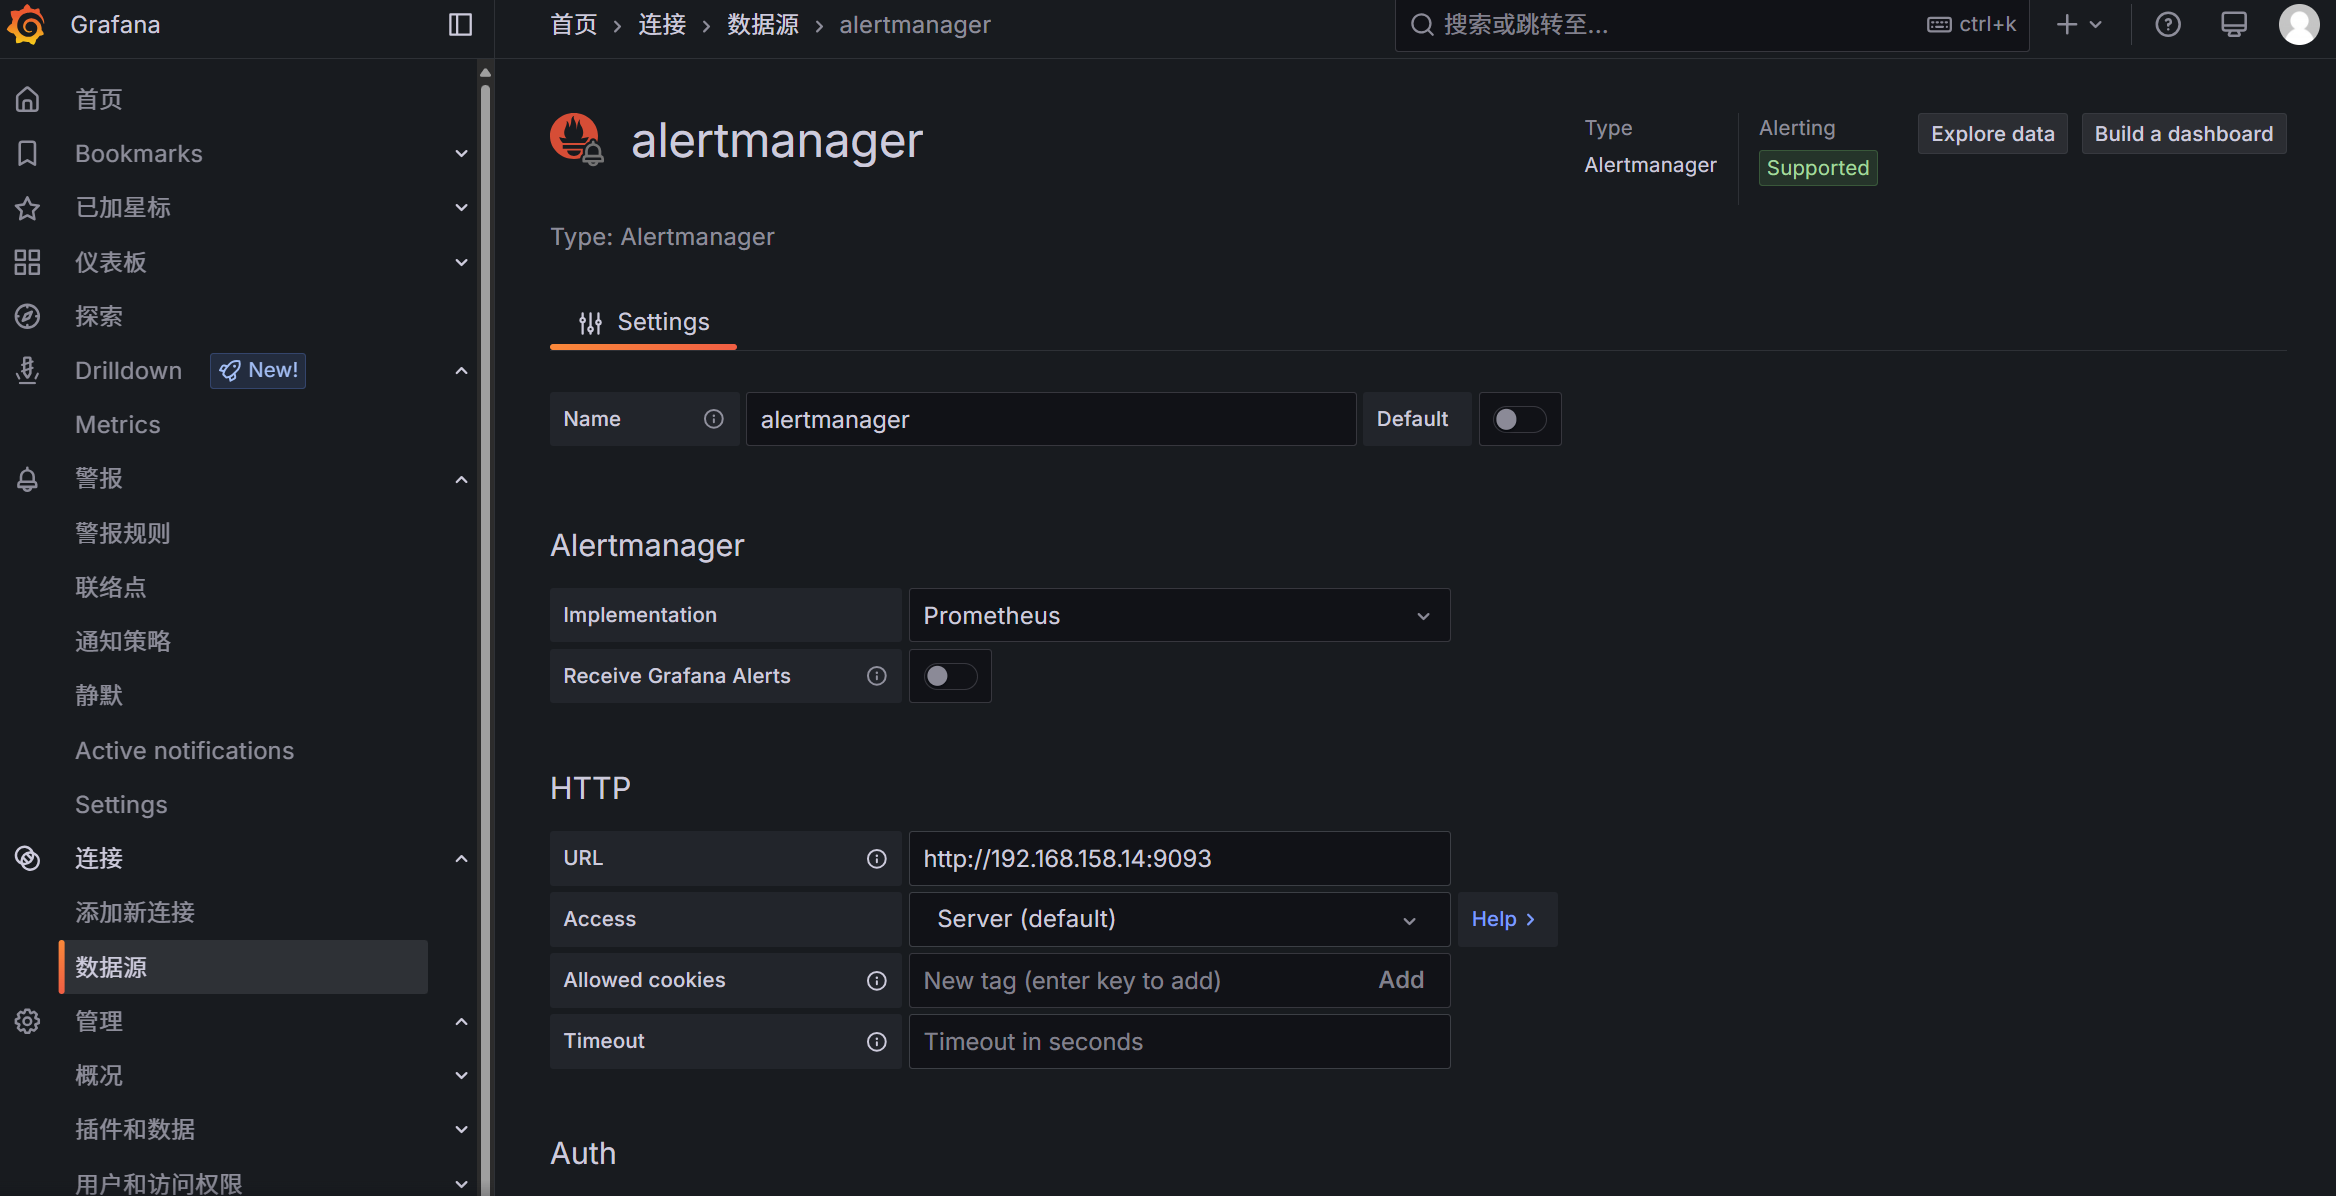
添加数据源

选择prometheus
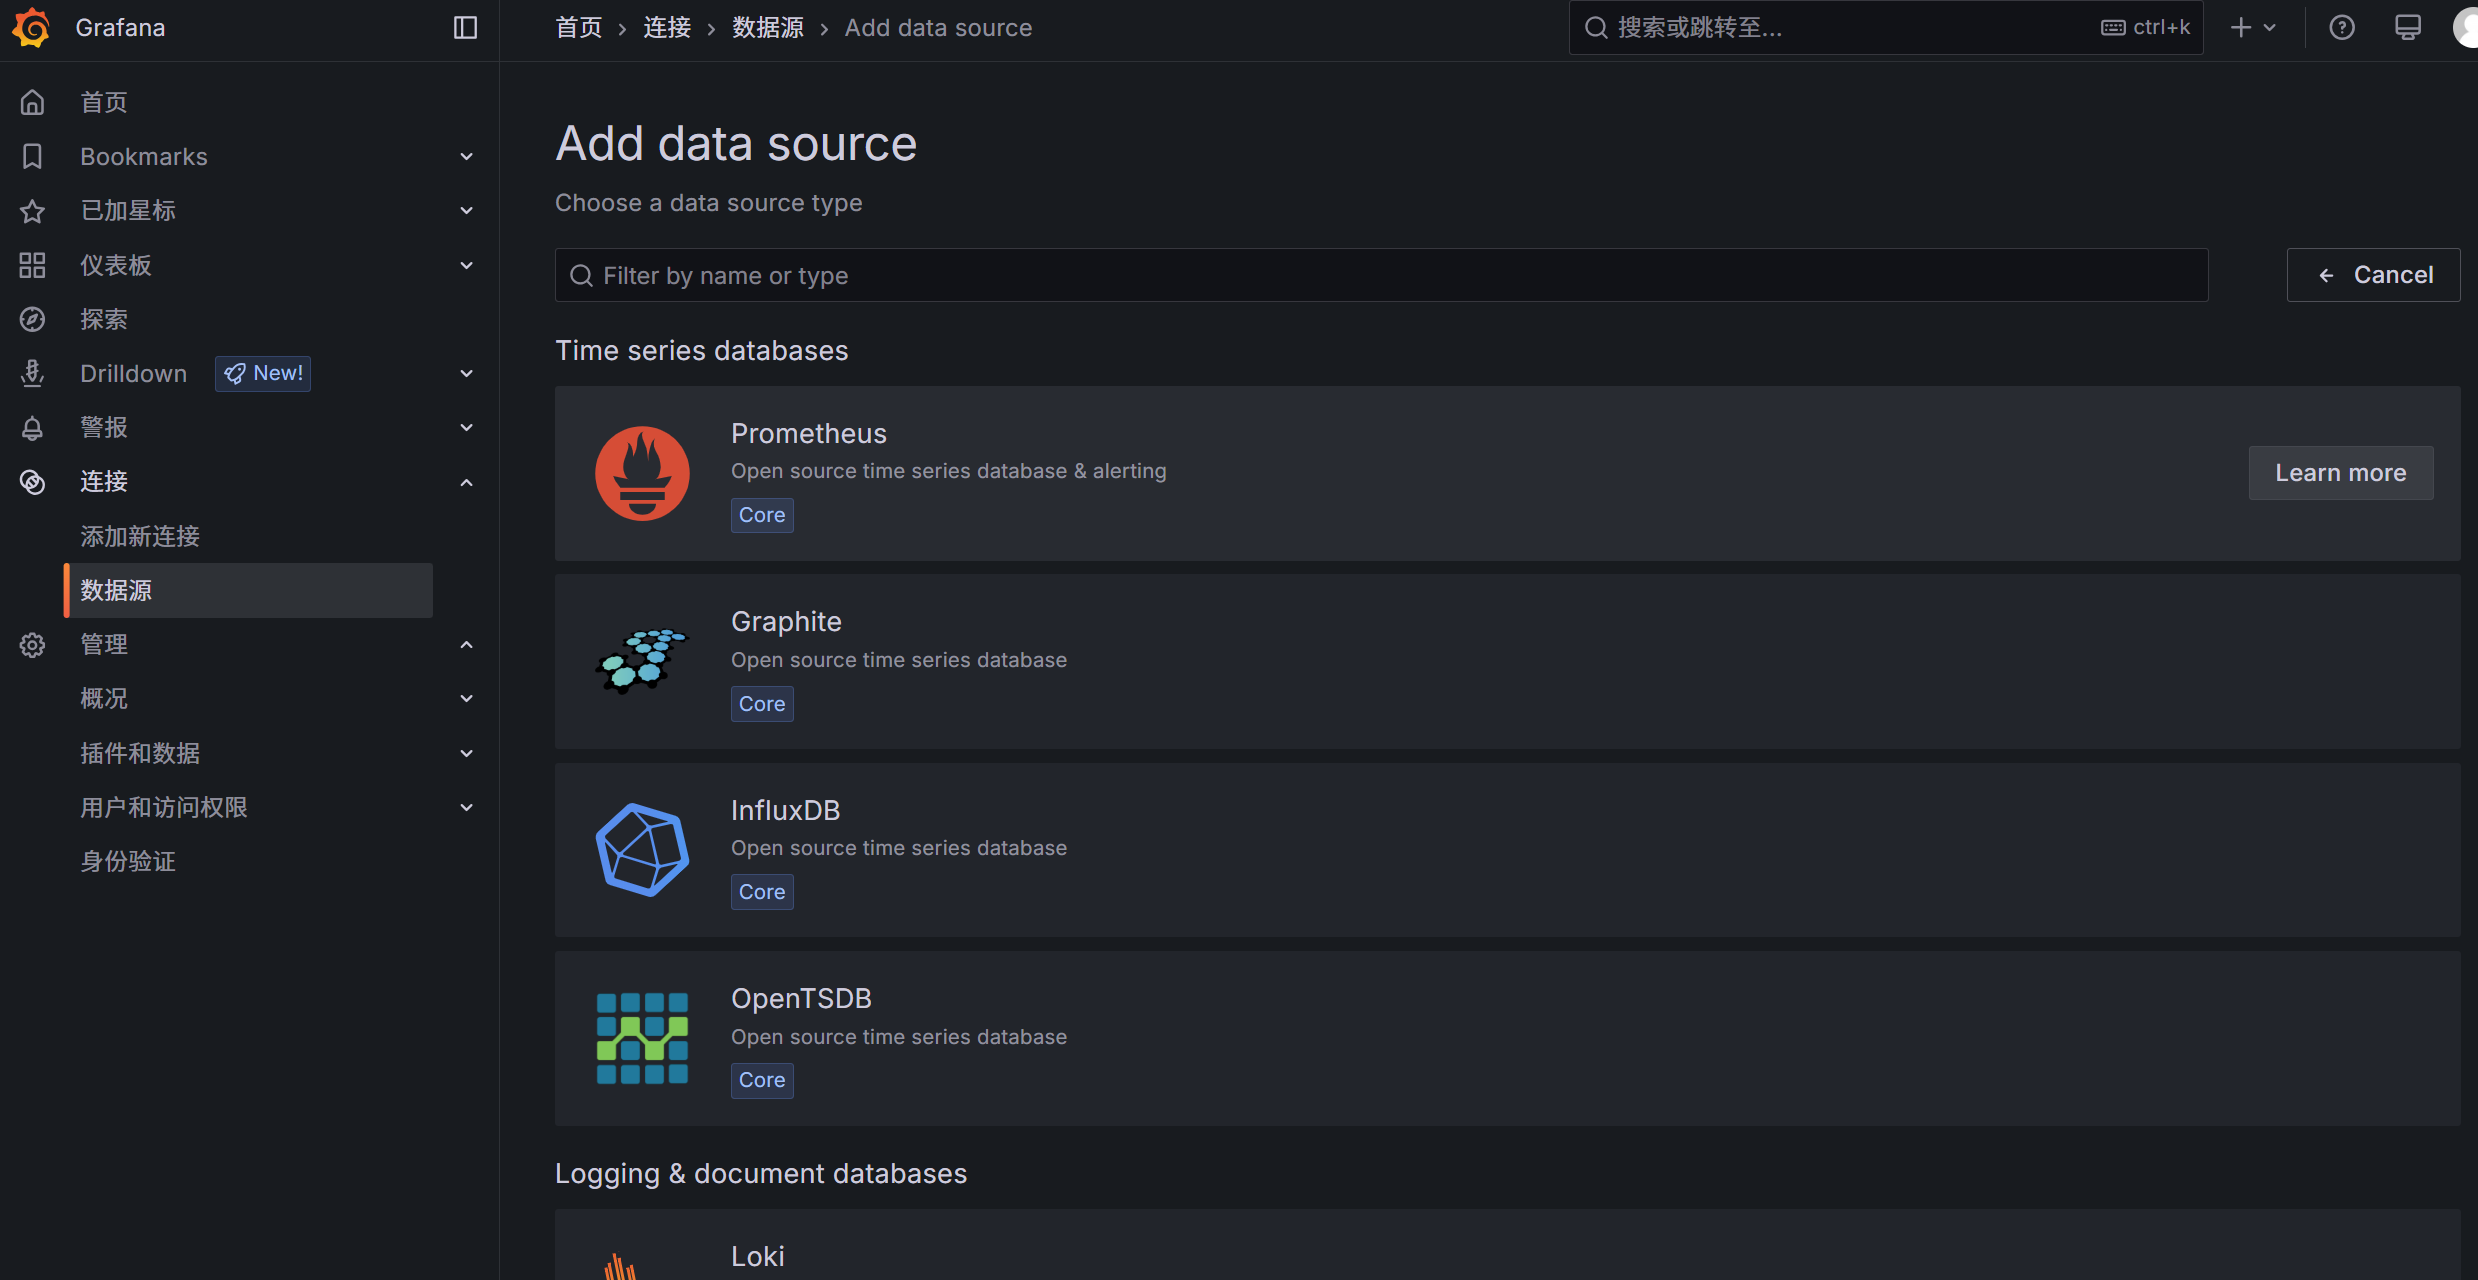
因为是本地,就写上
http://localhost:9090
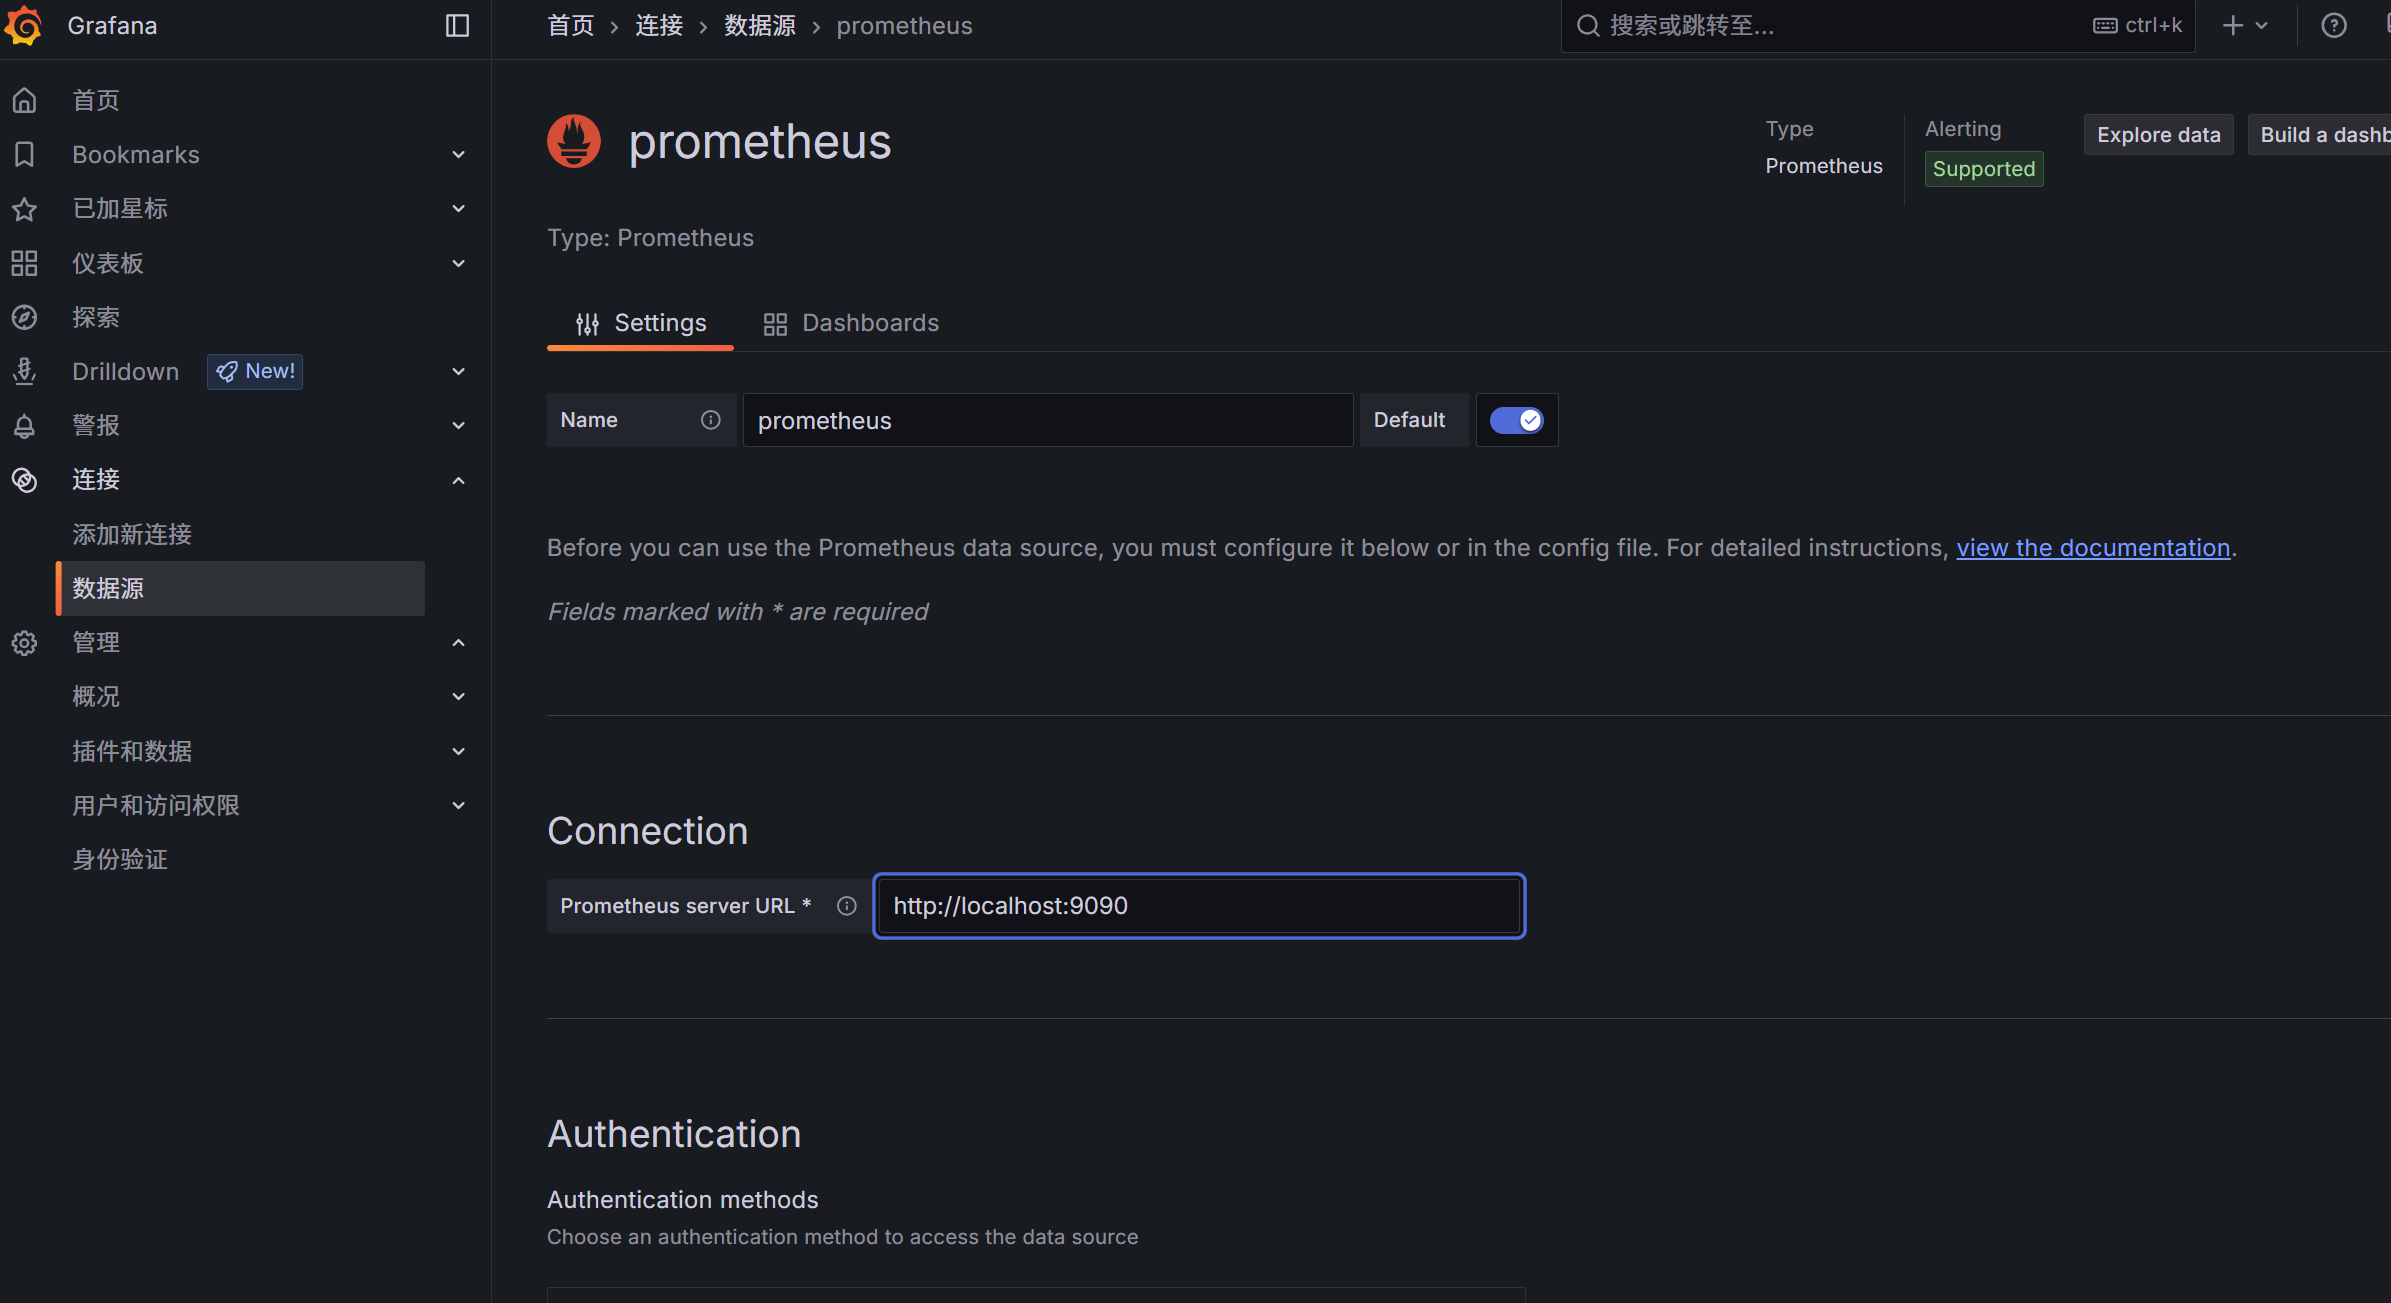
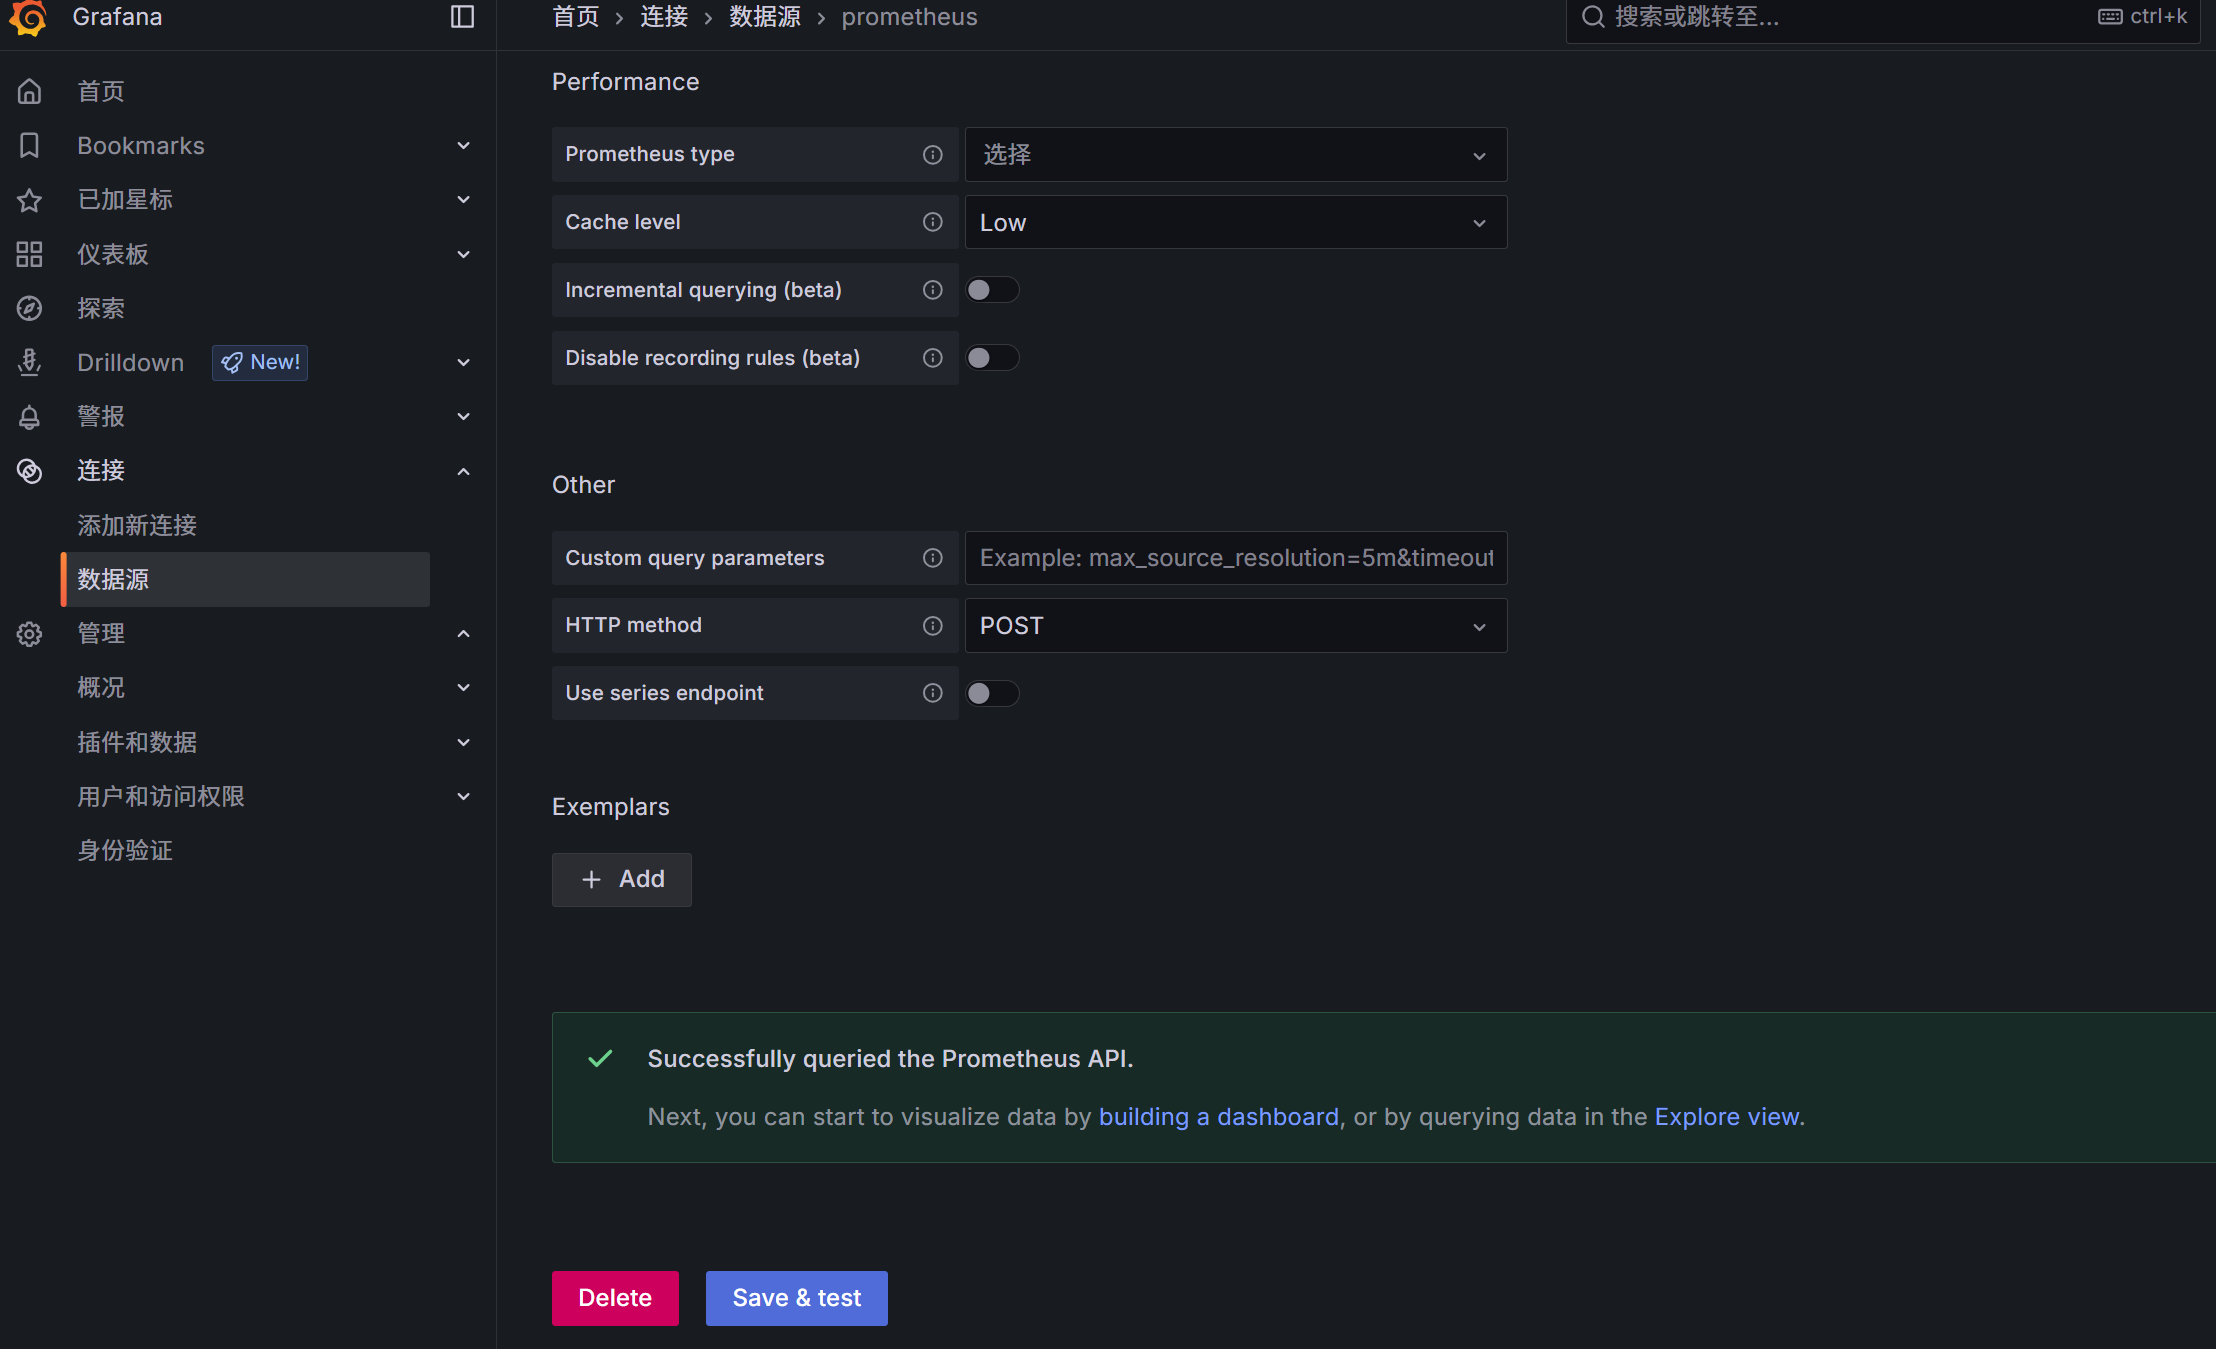
save&test
创建仪表板
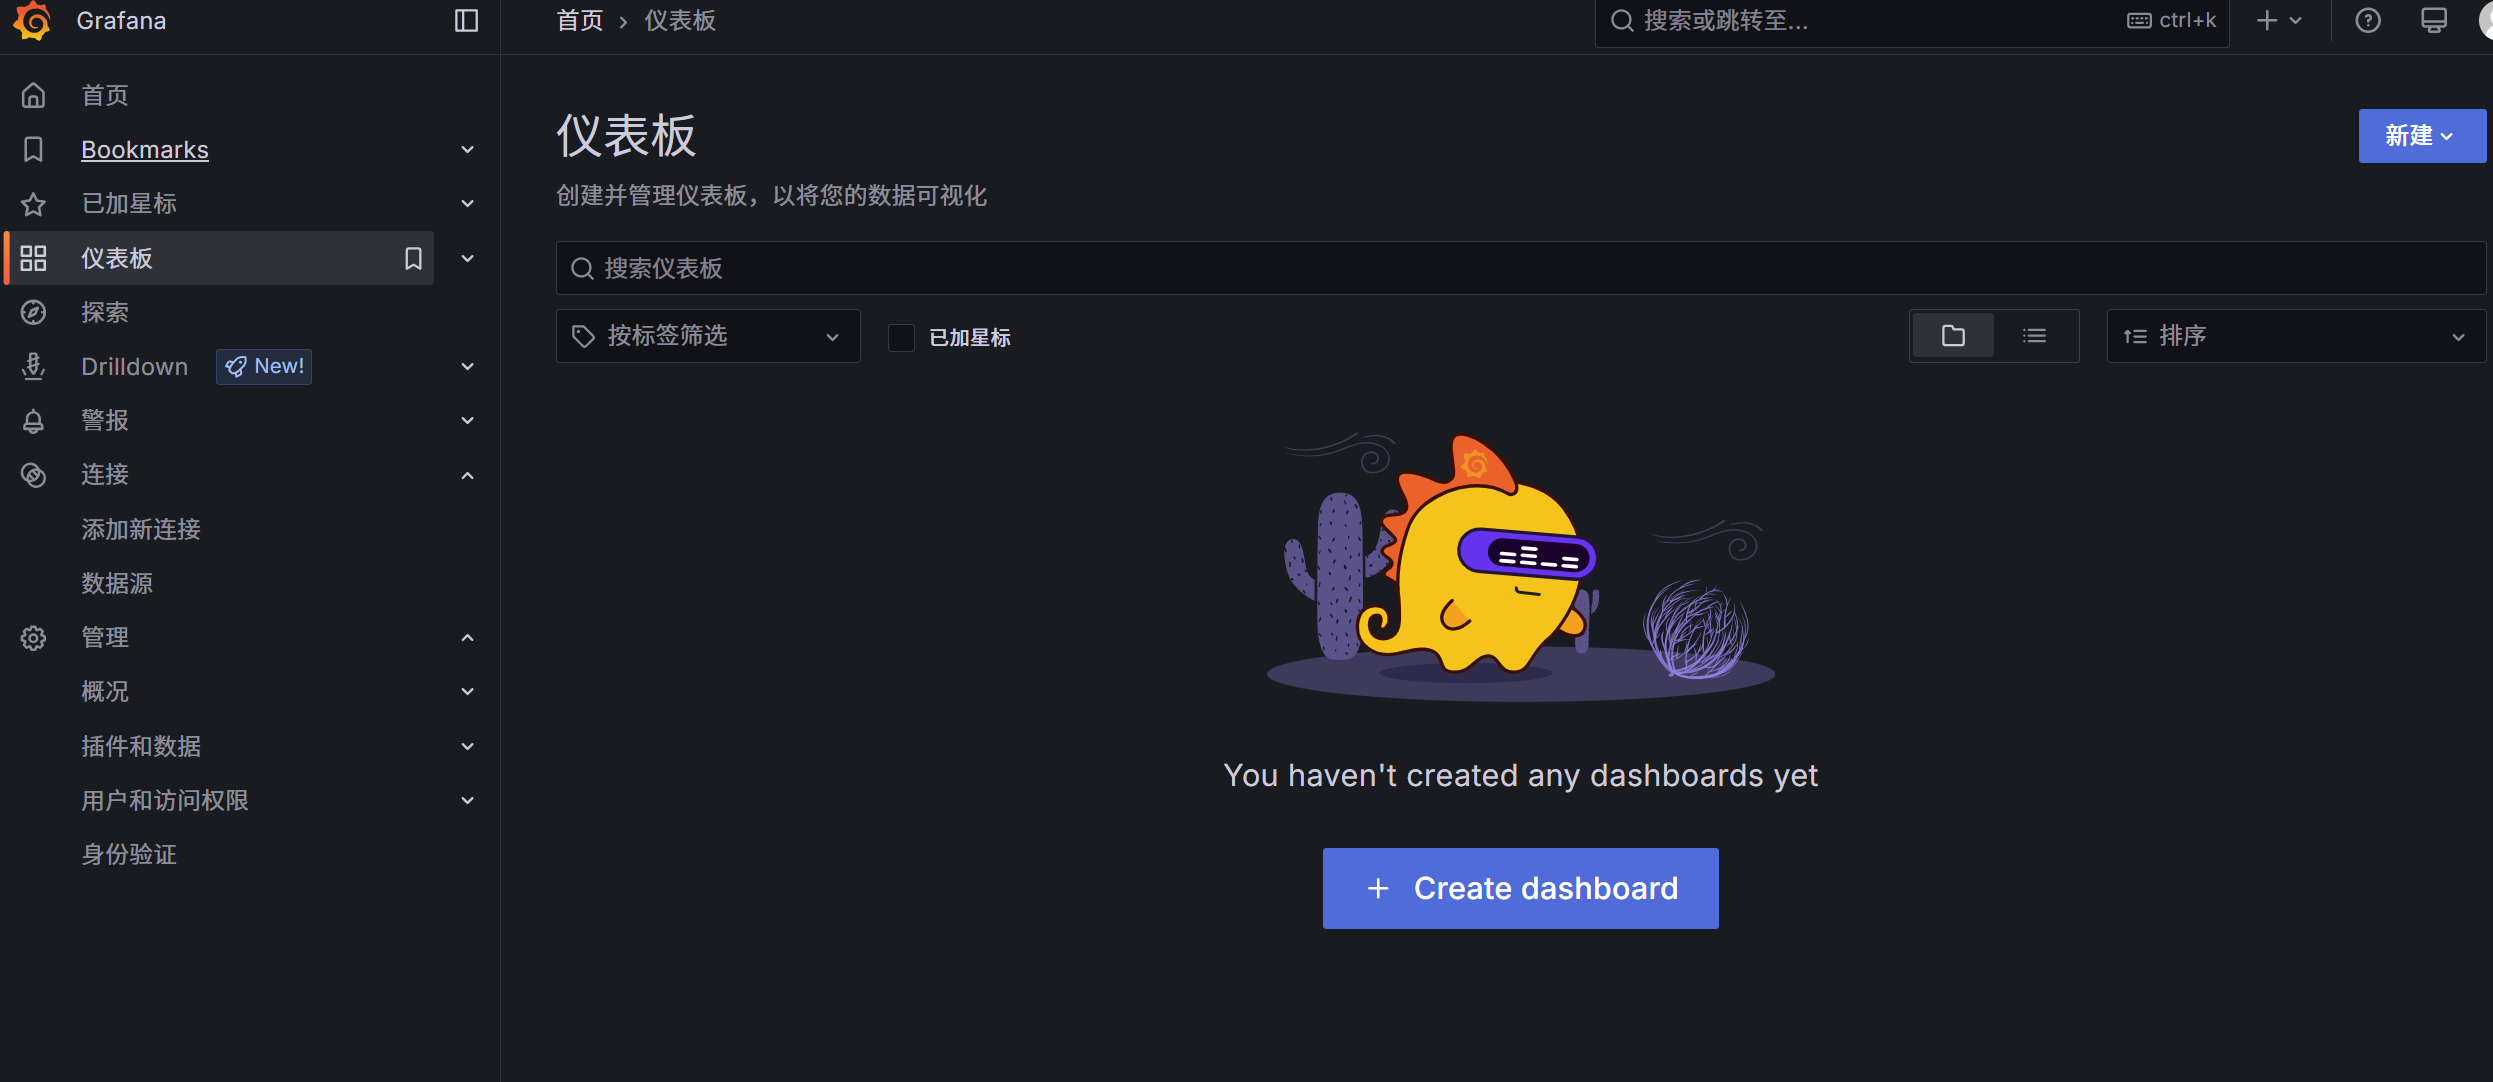
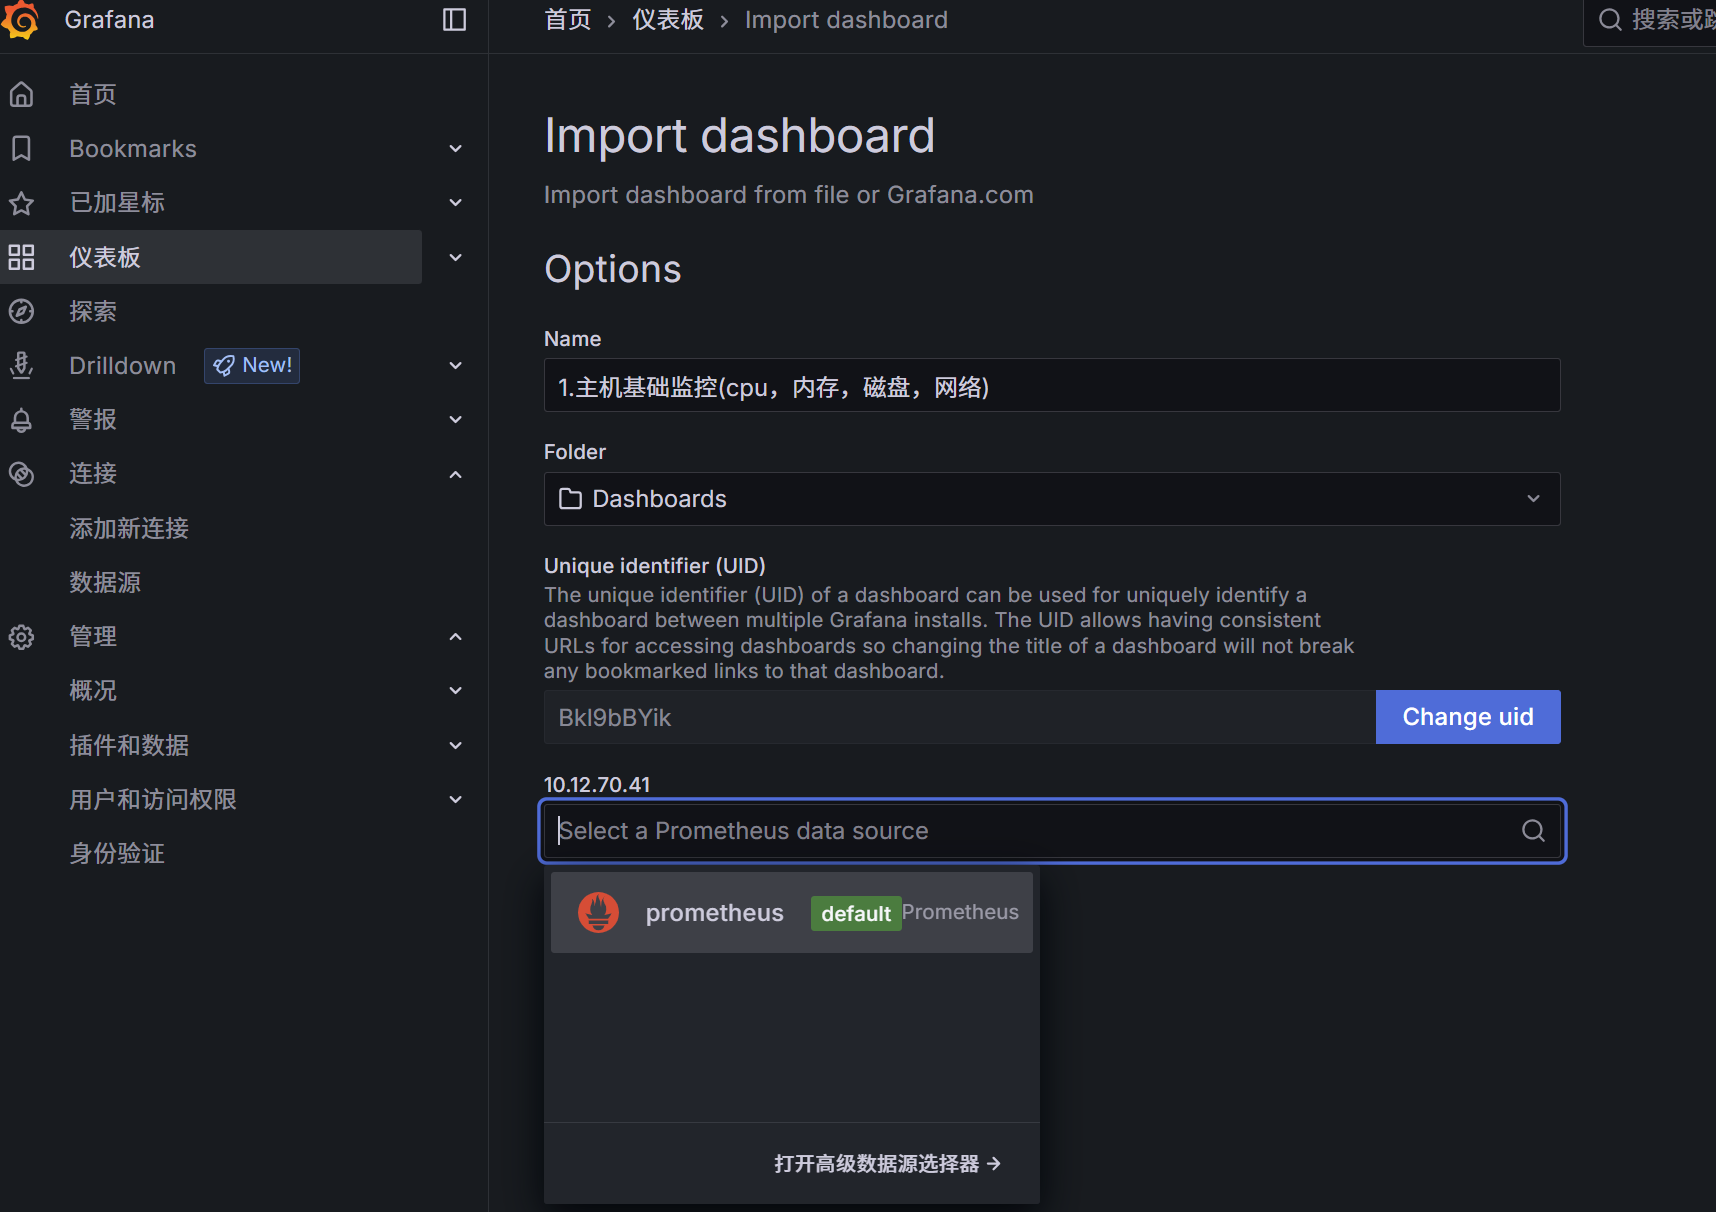
导入仪表板
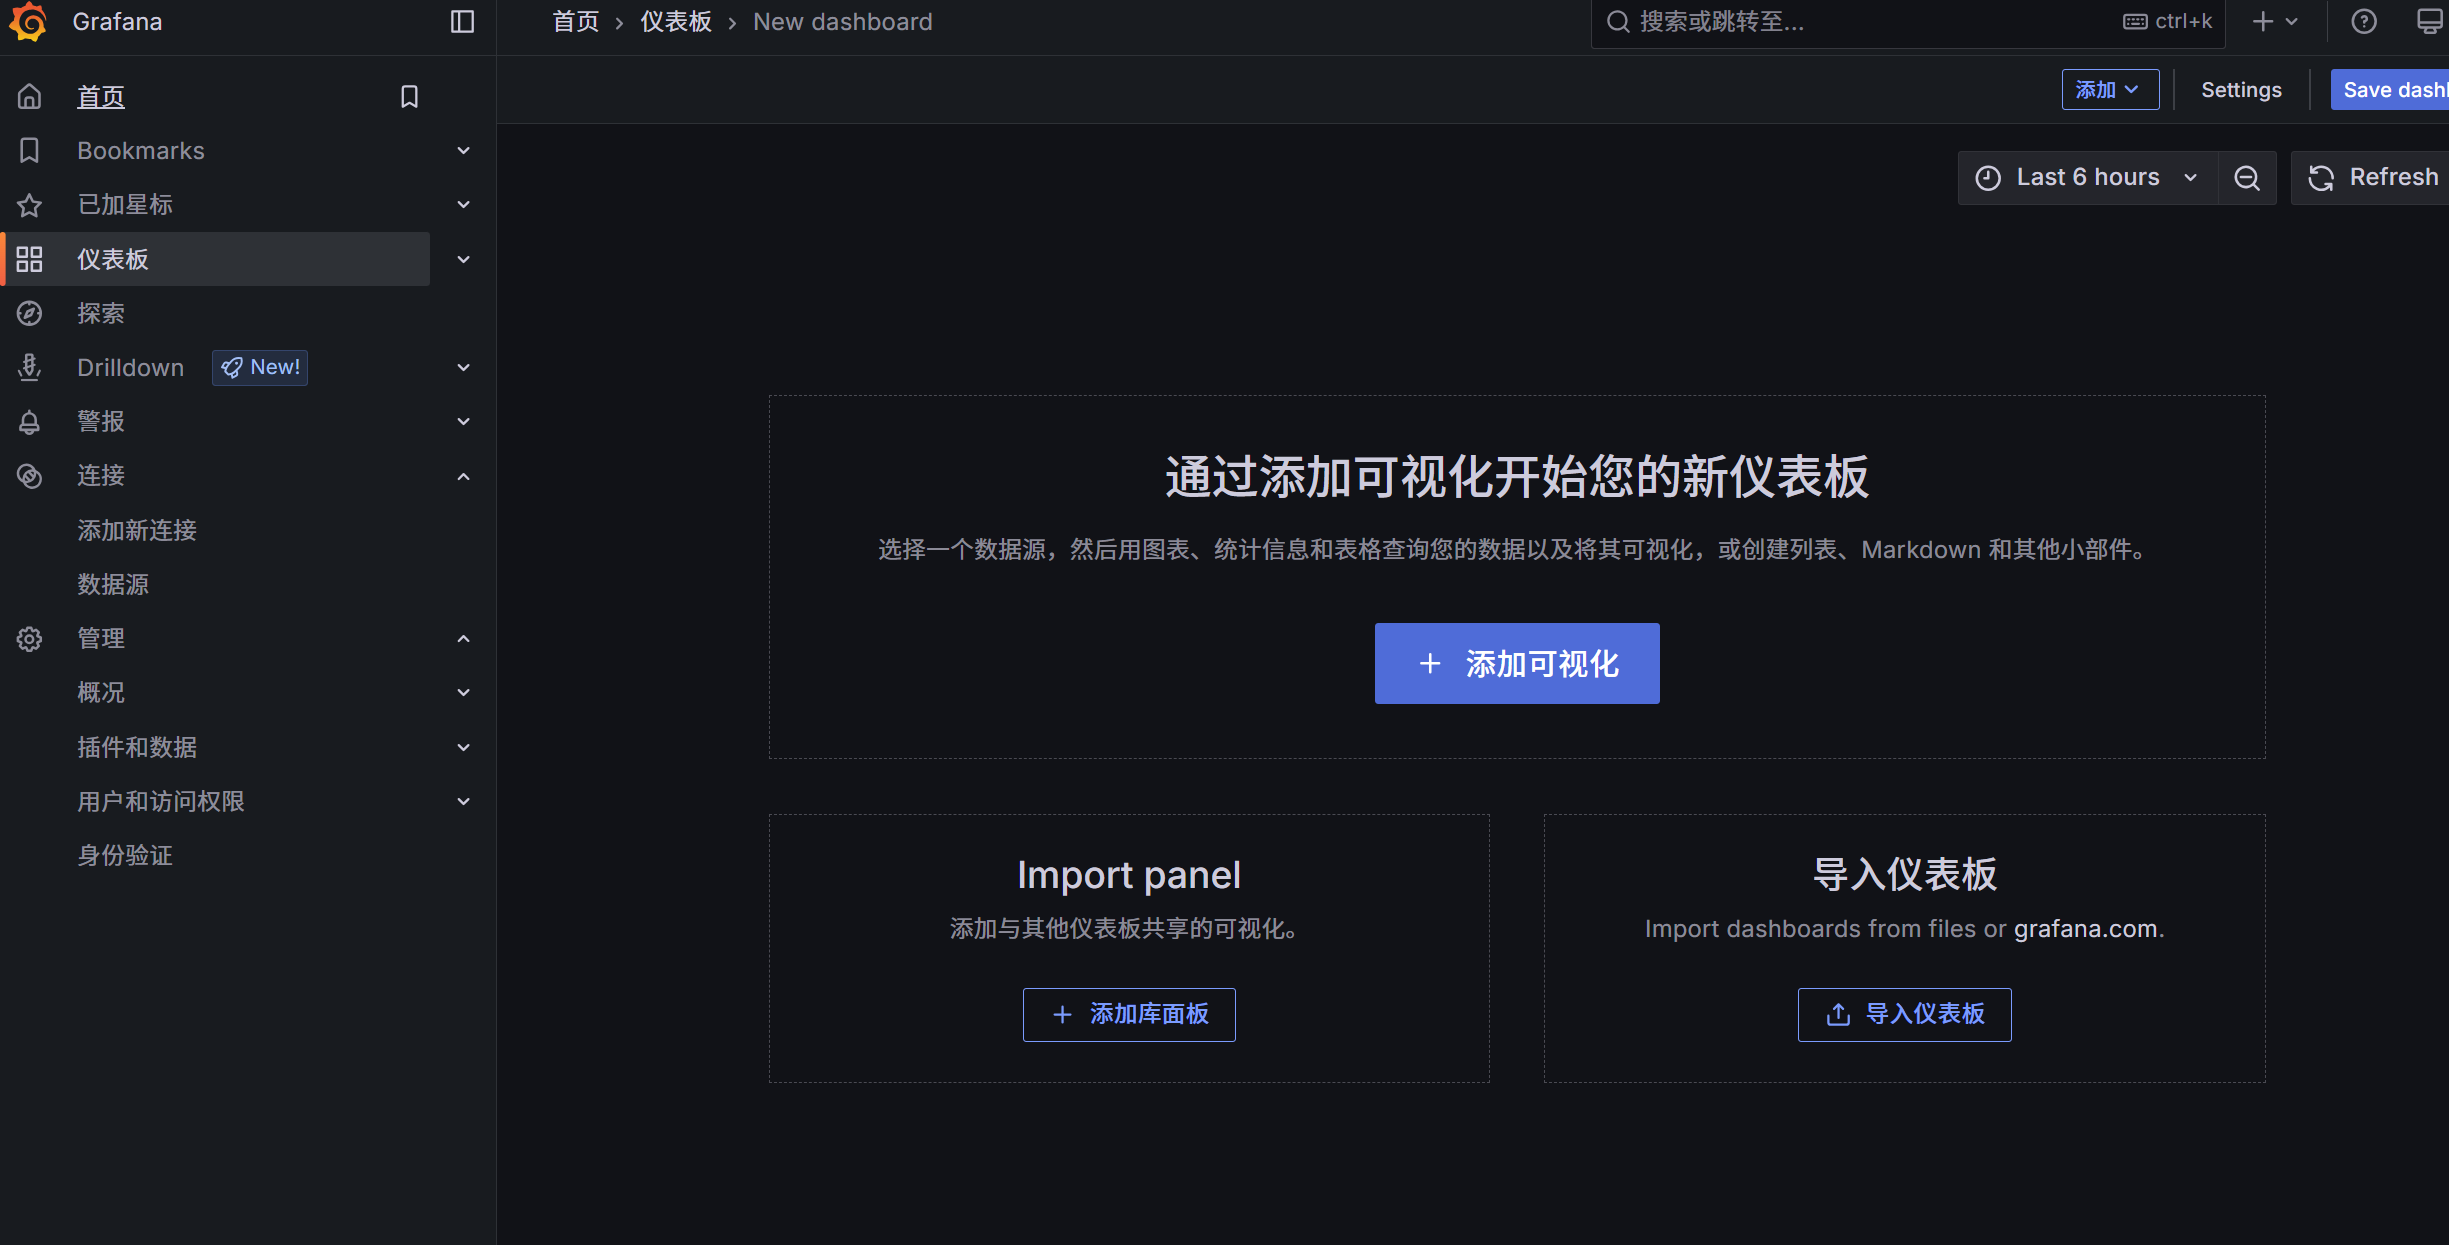
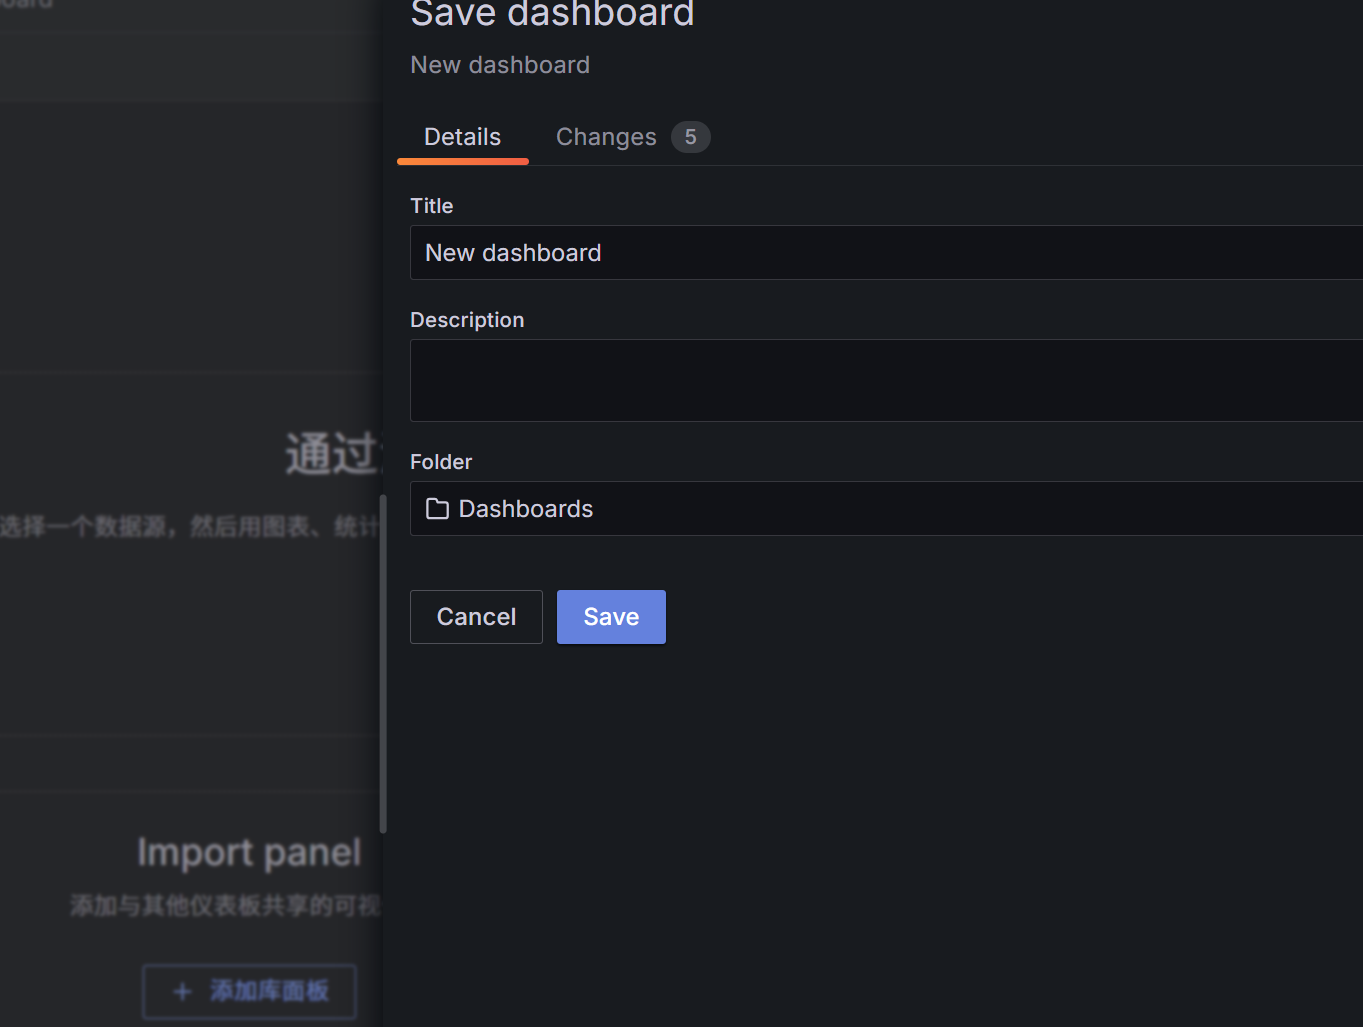
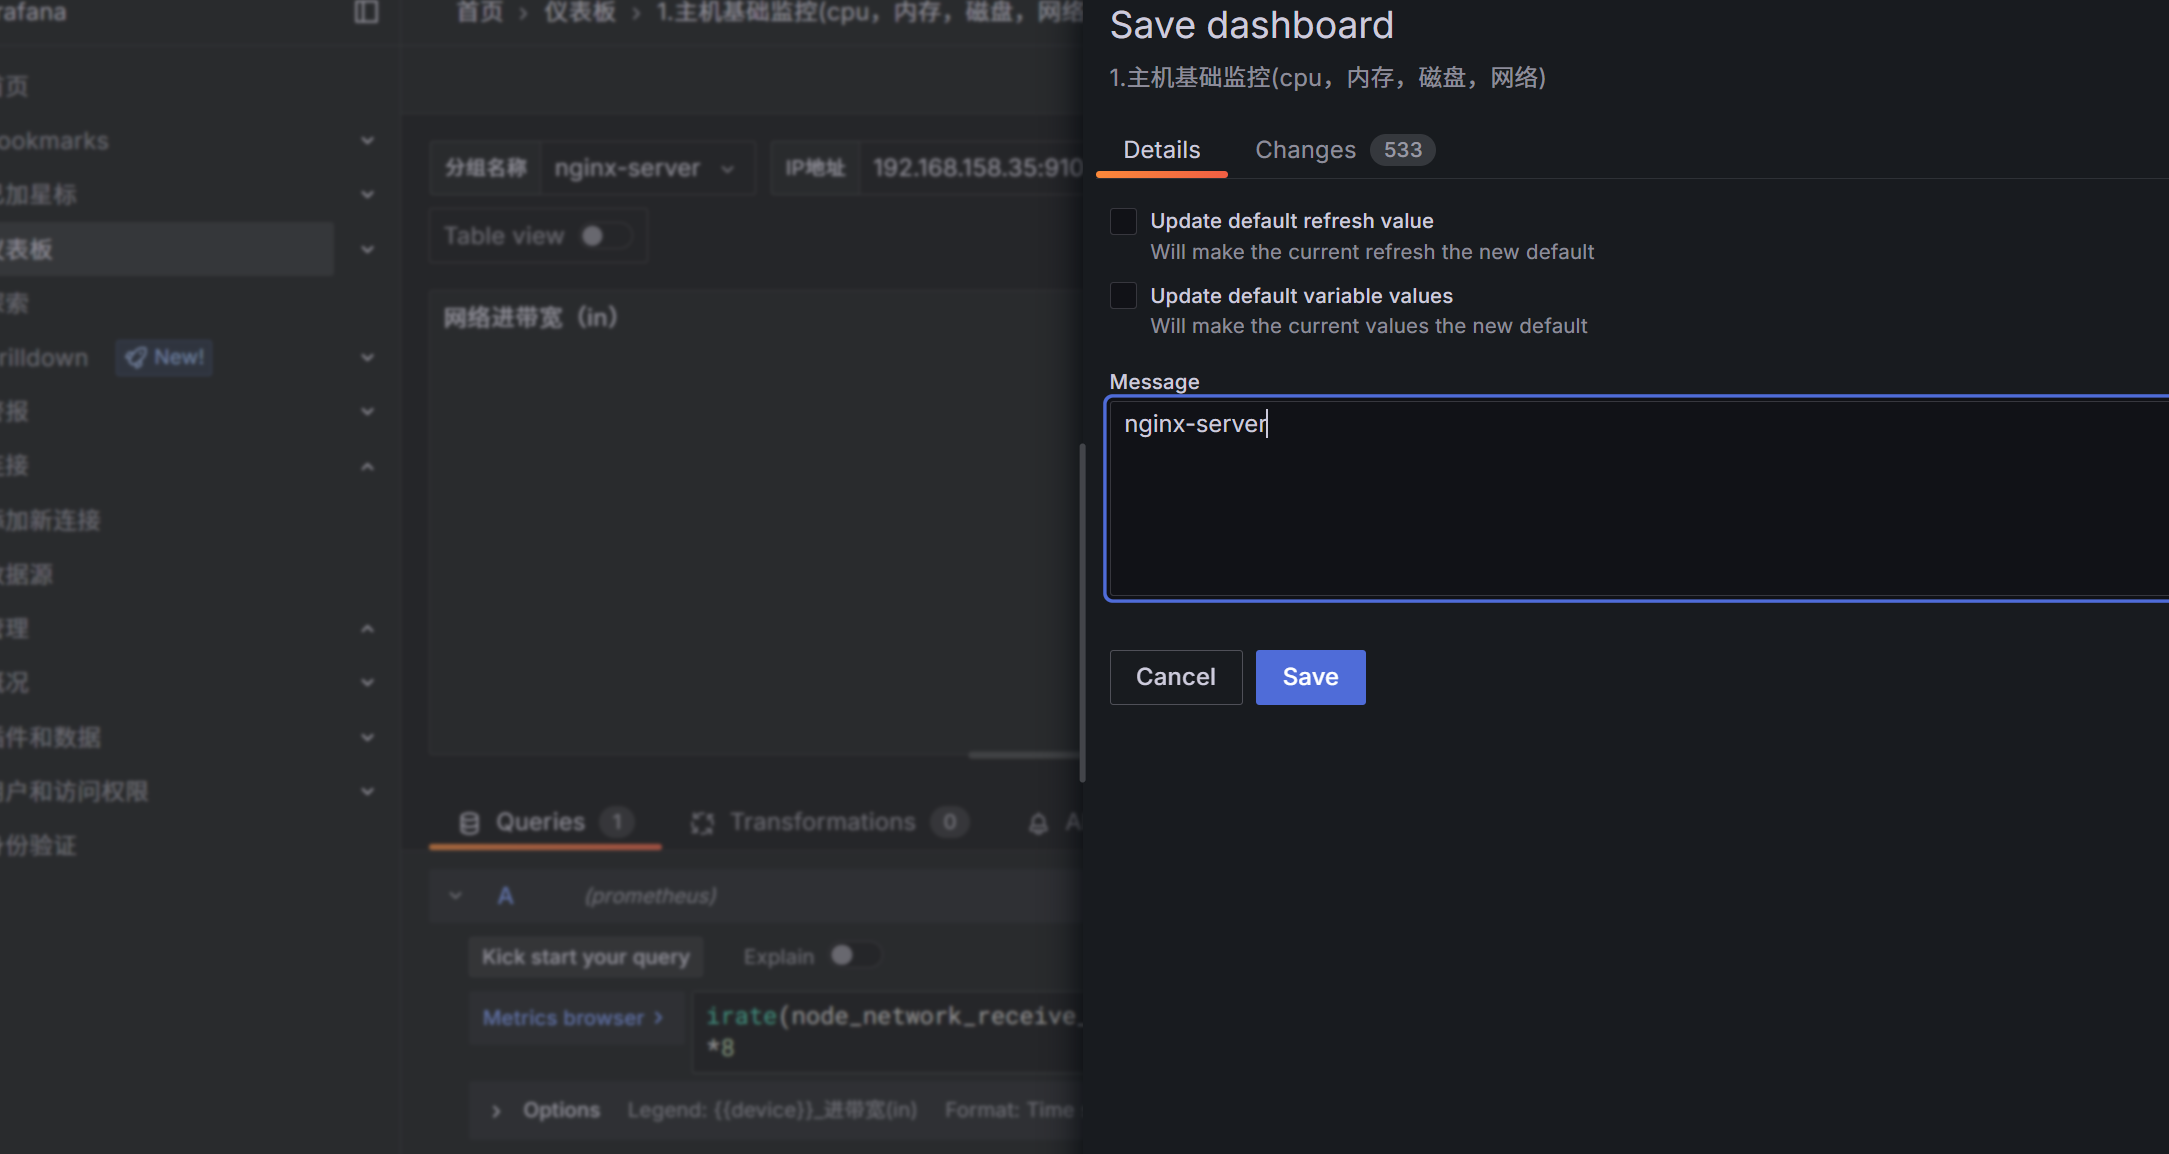
save dashboard
save
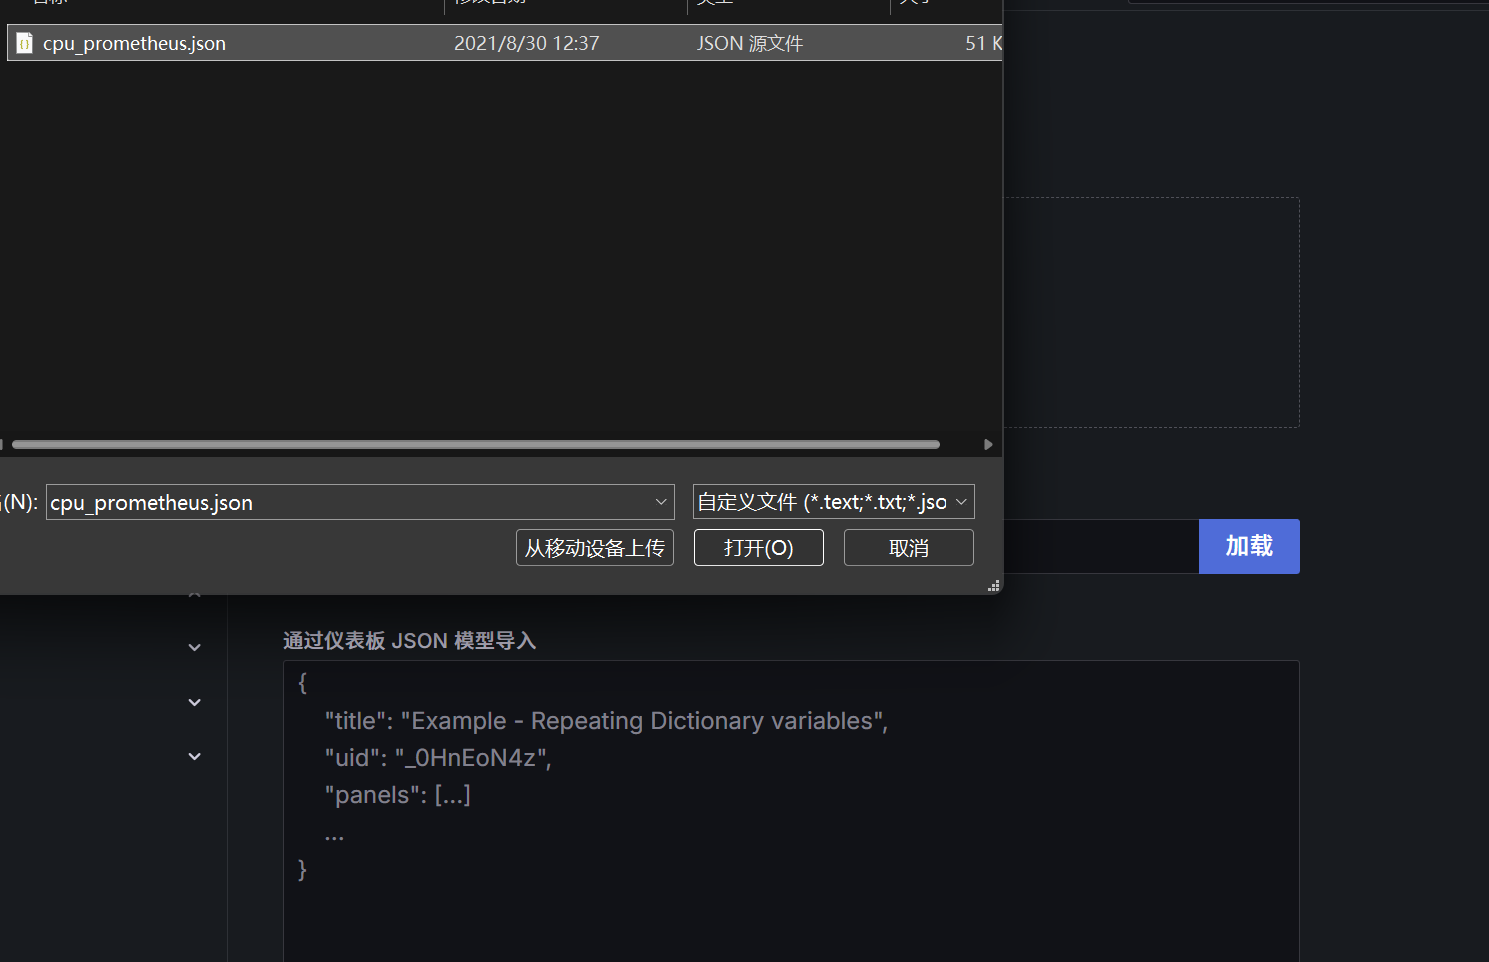
上传仪表板JSON文件
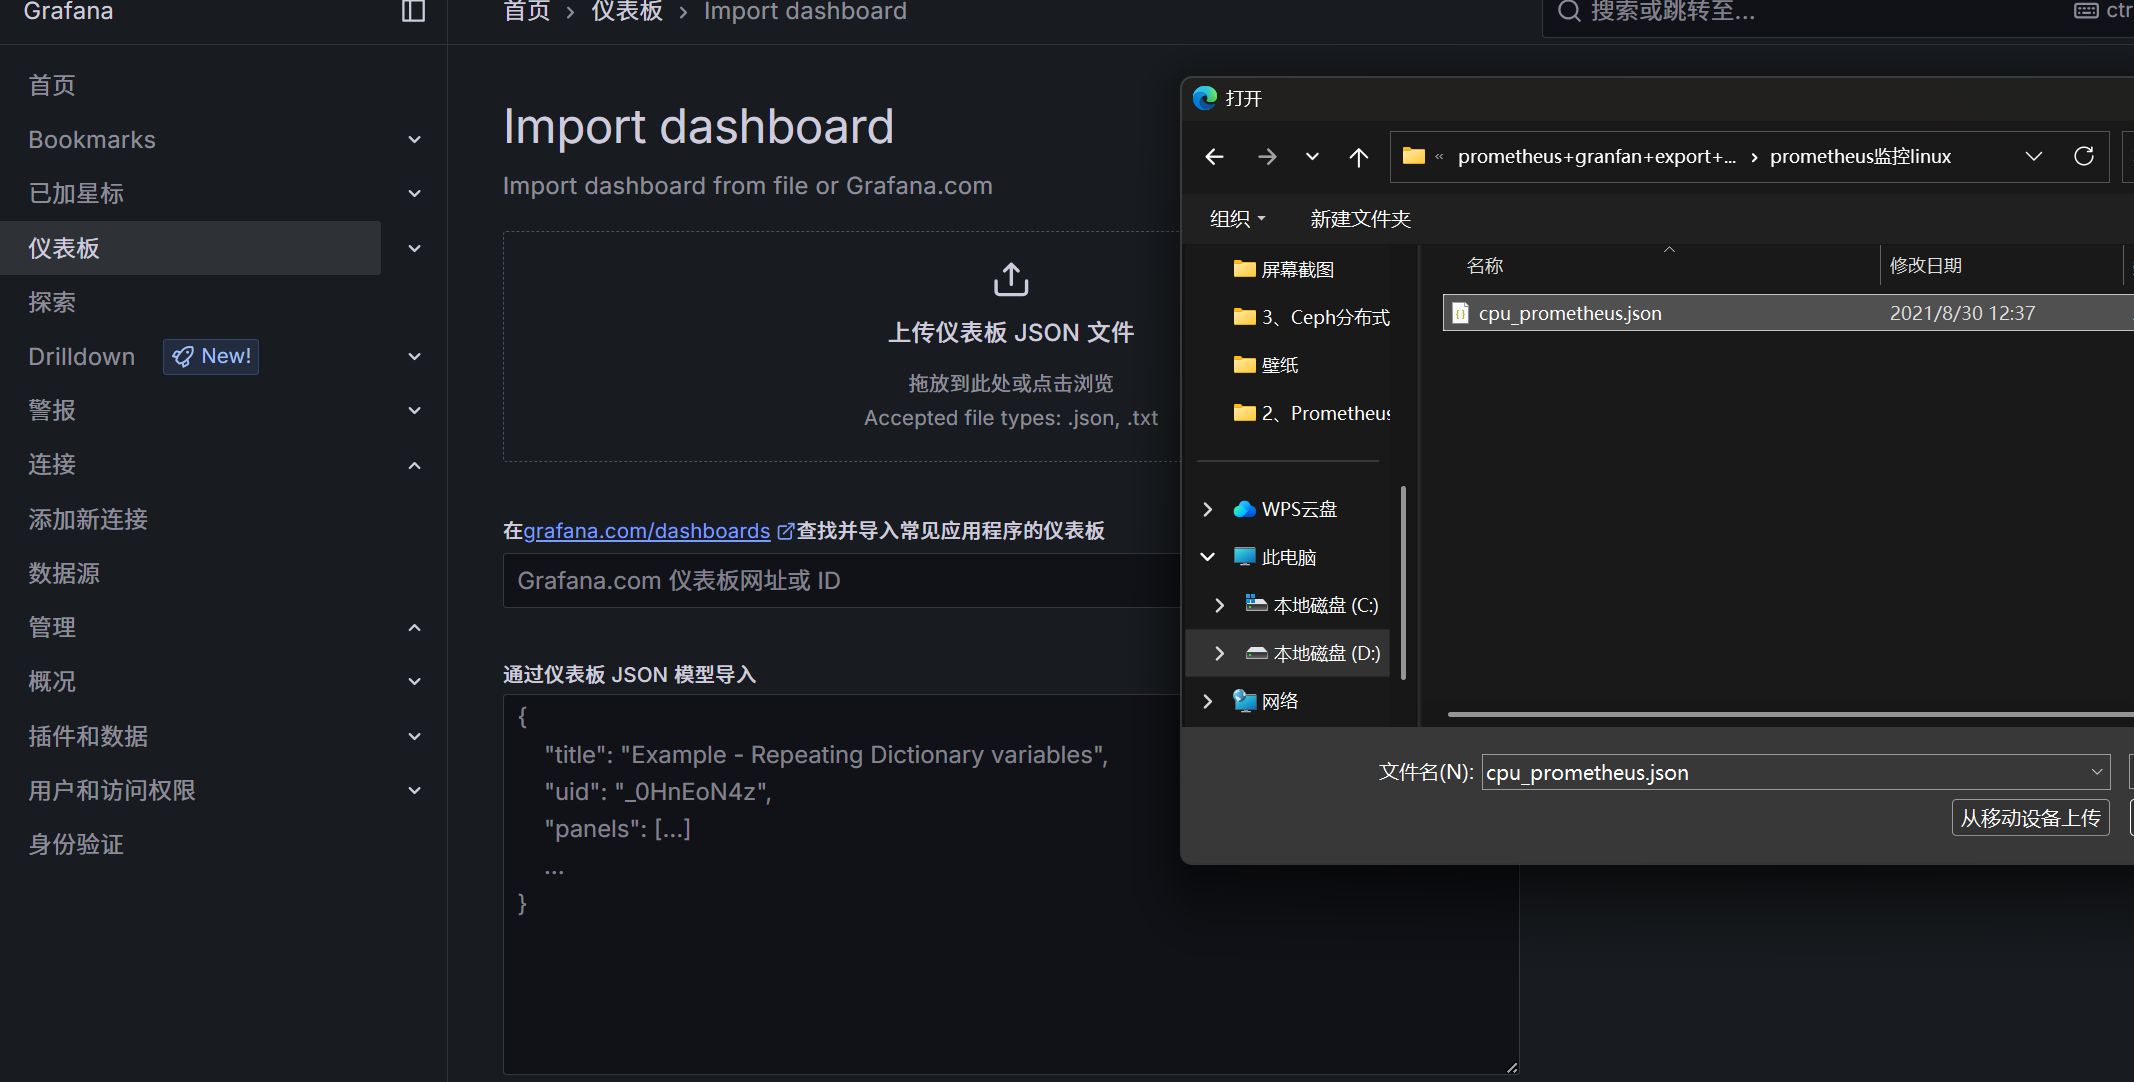
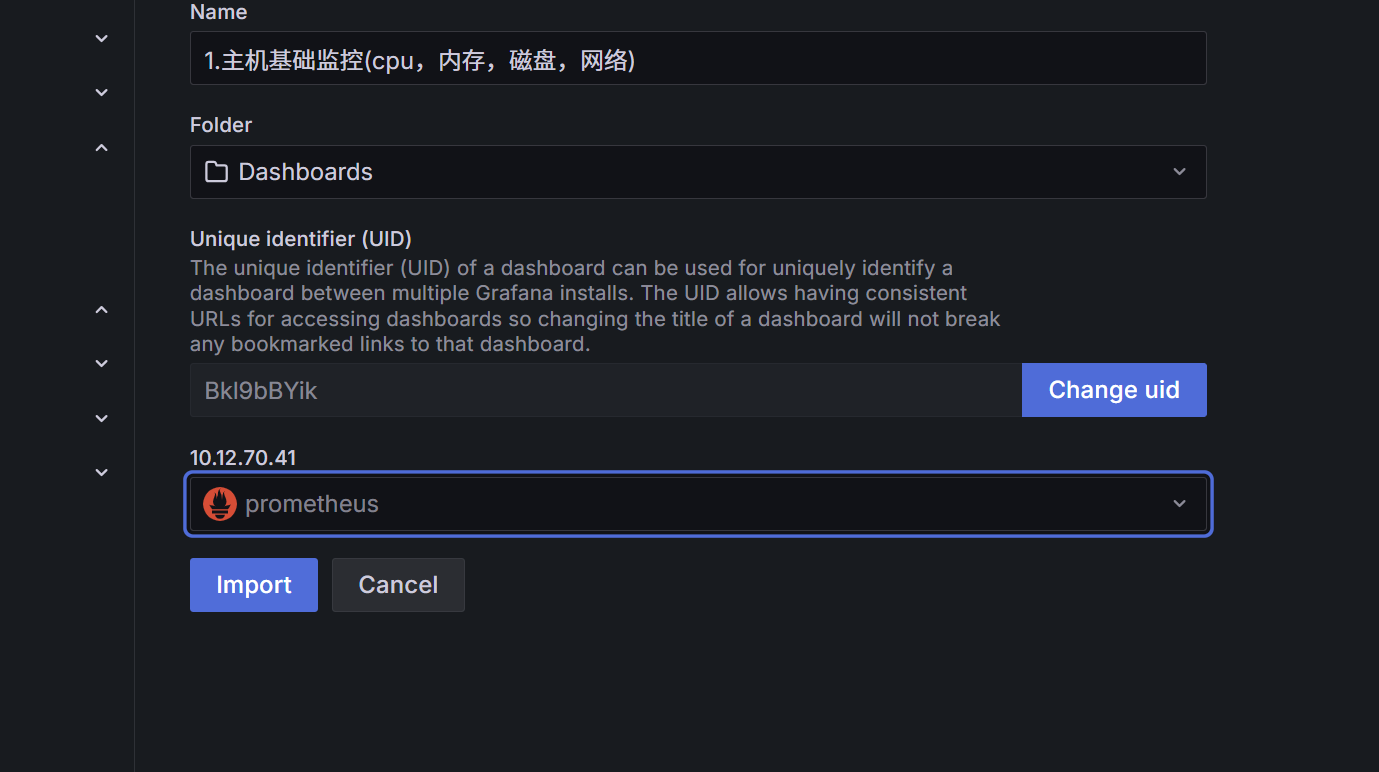
选择源
然后点击Import就进去了
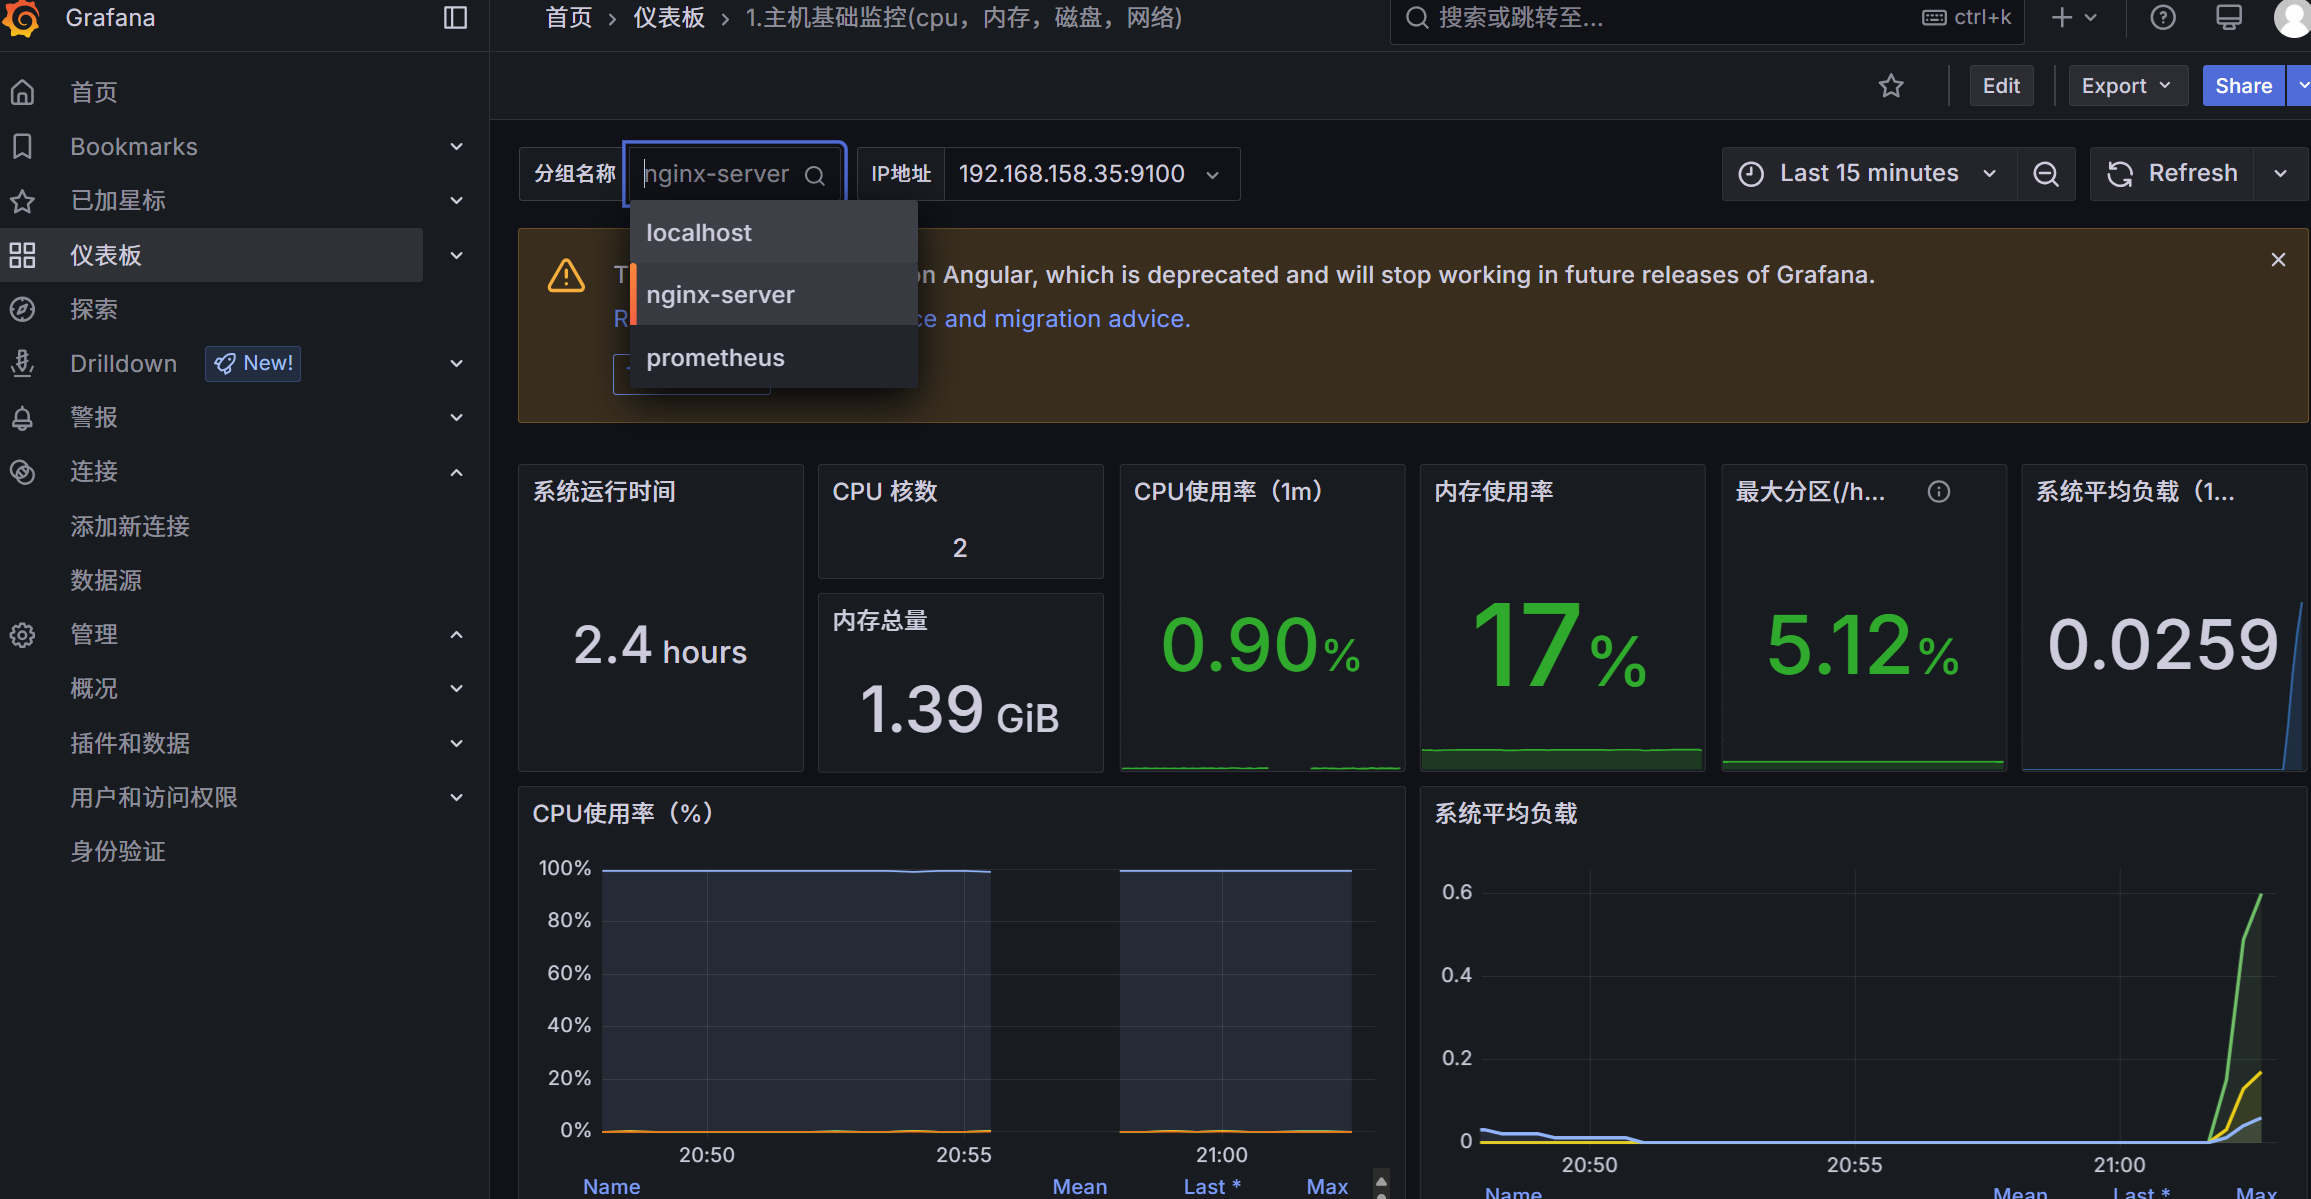
能看到prometheus监控本机的cpu数据
localhost:9100

再添加一台监控主机
监控192.168.158.35这台主机
在192.168.158.35主机上操作
安装exporter软件包
node_exporter-1.8.2.linux-amd64.tar.gz解压
[root@localhost ~]# tar xf node_exporter-1.8.2.linux-amd64.tar.gz 启用node
[root@localhost ~]# cd node_exporter-1.8.2.linux-amd64/
[root@localhost node_exporter-1.8.2.linux-amd64]# ls
LICENSE  node_exporter  NOTICE
[root@localhost node_exporter-1.8.2.linux-amd64]# nohup ./node_exporter &
[1] 41459
[root@localhost node_exporter-1.8.2.linux-amd64]# nohup: 忽略输入并把输出追加到 'nohup.out'

[root@localhost node_exporter-1.8.2.linux-amd64]#
[root@localhost node_exporter-1.8.2.linux-amd64]# ls
LICENSE  node_exporter  nohup.out  NOTICE
[root@localhost node_exporter-1.8.2.linux-amd64]# netstat -anptu | grep node
tcp6       0      0 :::9100                 :::*                    LISTEN      41459/./node_export
tcp6       0      0 192.168.158.35:9100     192.168.158.14:57792    ESTABLISHED 41459/./node_export
回到prometheus主机
修改prometheus.yml文件
[root@prometheus ~]# cd /usr/local/prometheus/
[root@prometheus prometheus]# ls
data  LICENSE  nohup.out  NOTICE  prometheus  prometheus.yml  promtool
[root@prometheus prometheus]# vim prometheus.yml 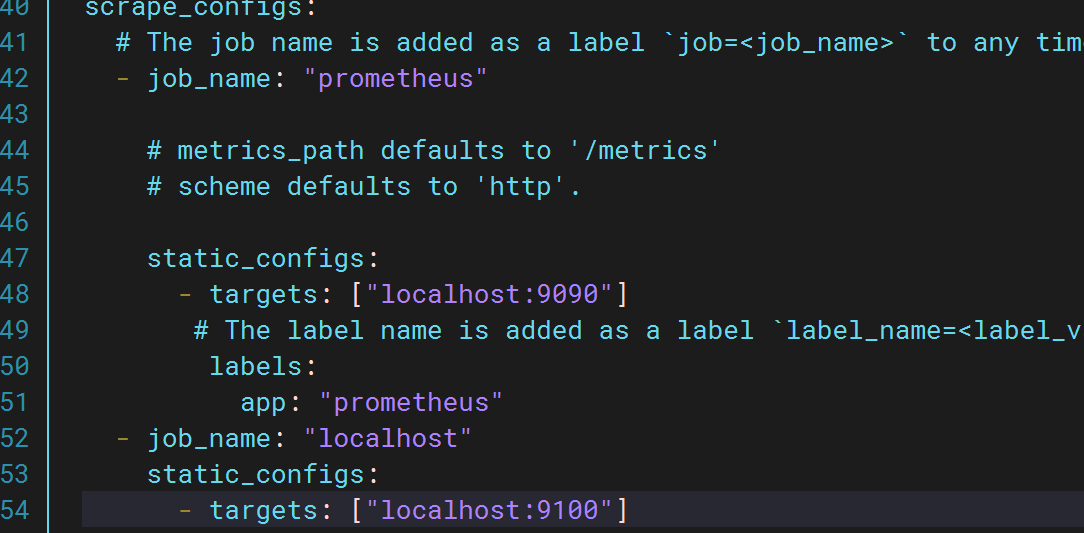
重新启用prometheus
[root@prometheus prometheus]# killall  prometheus
[root@prometheus prometheus]# netstat -anptu | grep prometheus
[root@prometheus prometheus]# nohup prometheus --config.file=/usr/local/prometheus/prometheus.yml &
[3] 36239
[root@prometheus prometheus]# nohup: 忽略输入并把输出追加到 'nohup.out'
回到监控页面操作
需要先删除
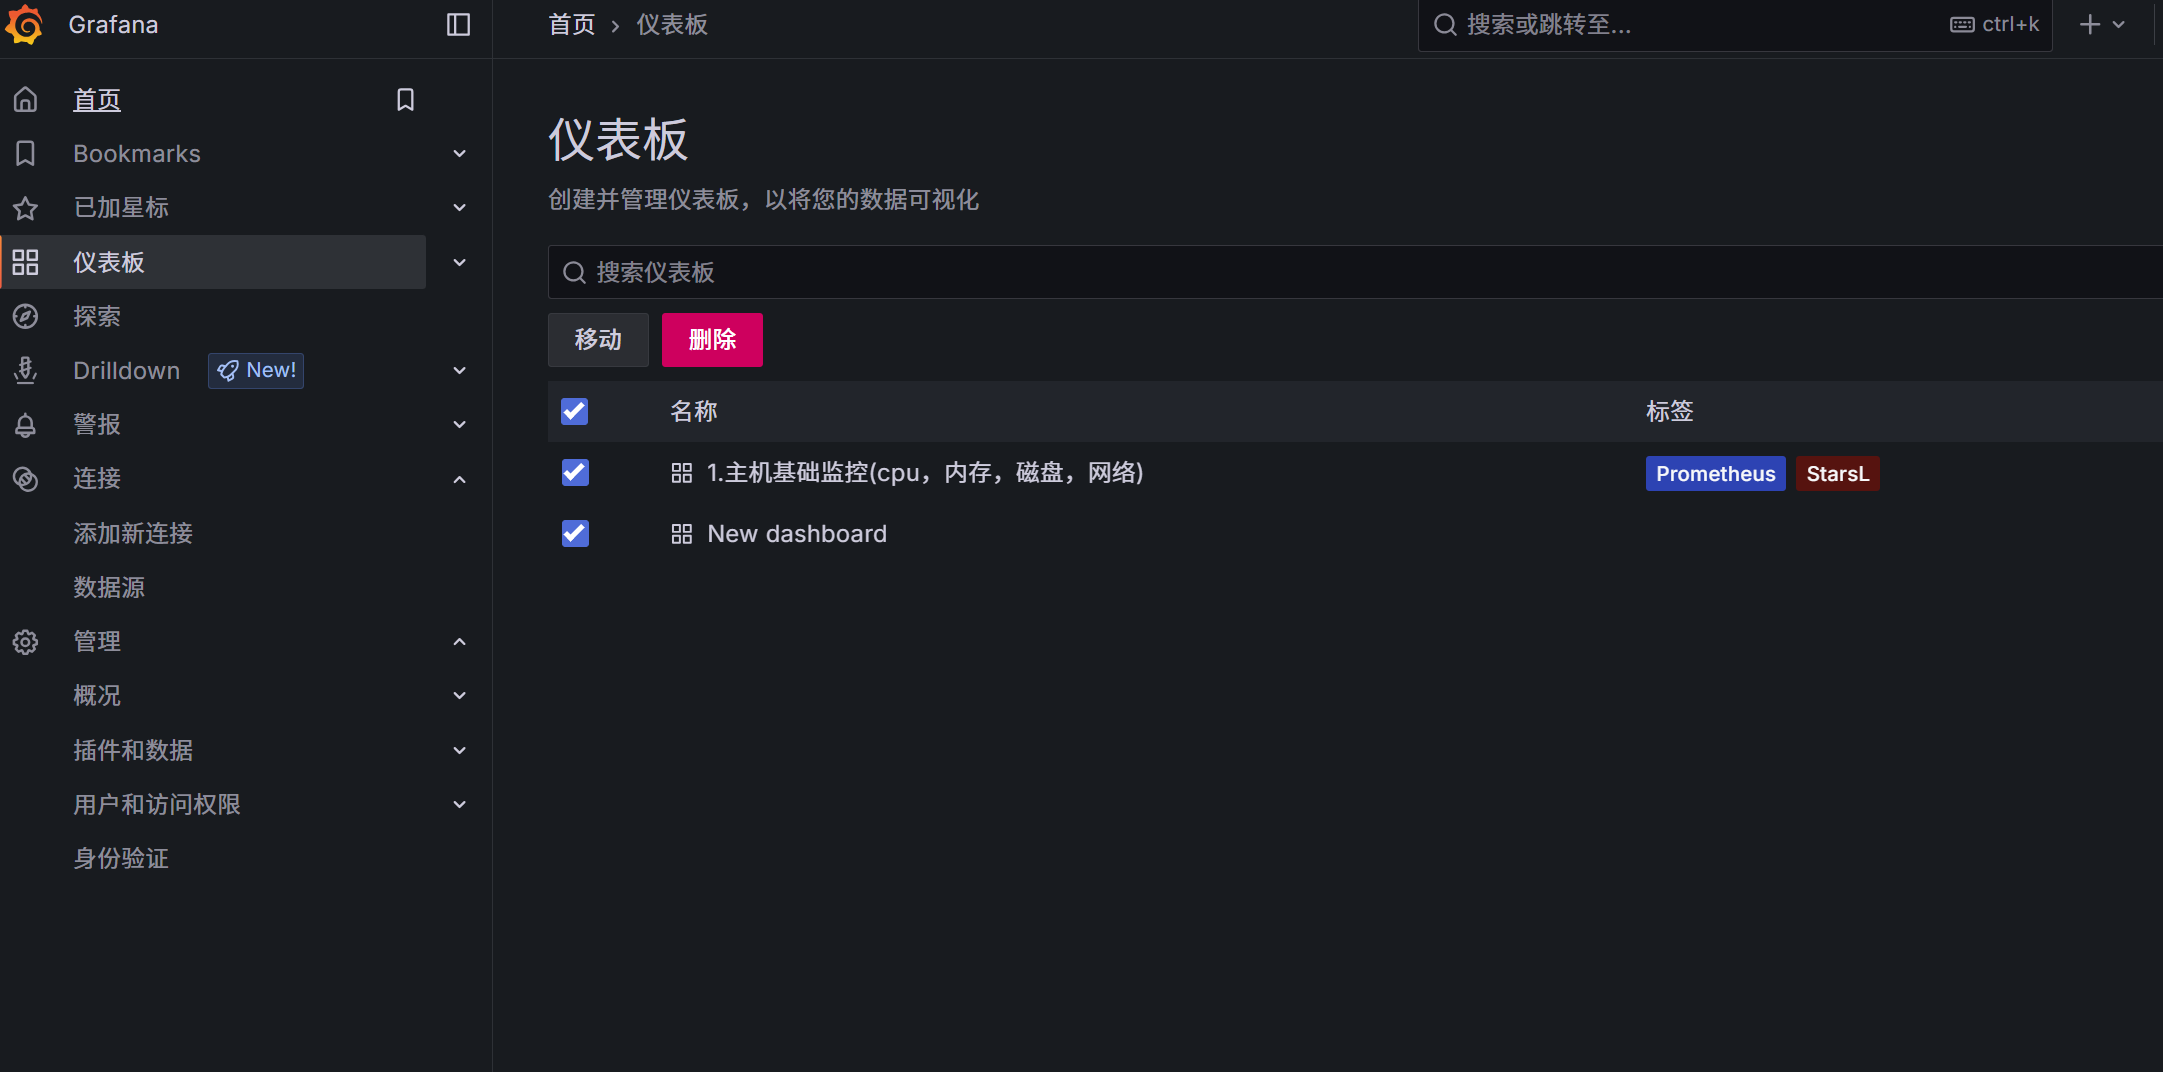
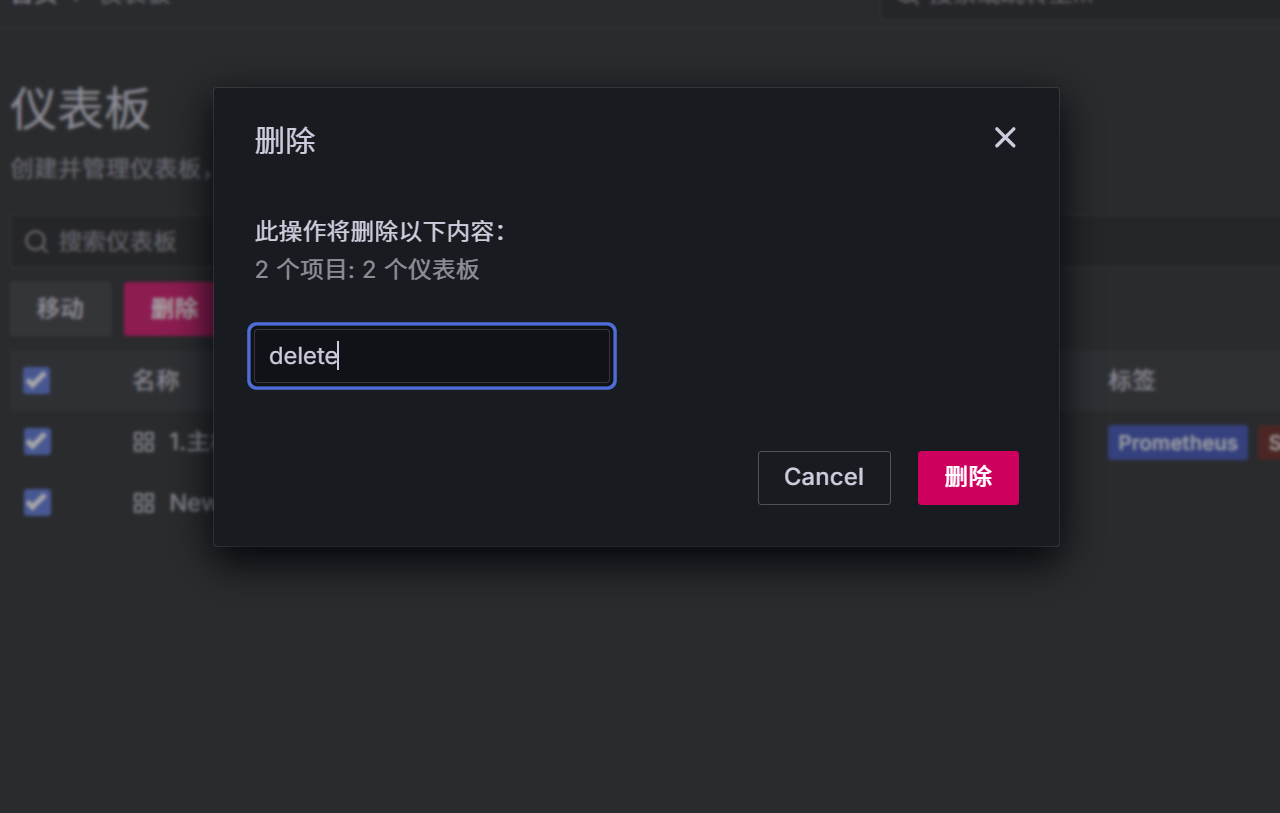
再创建仪表板
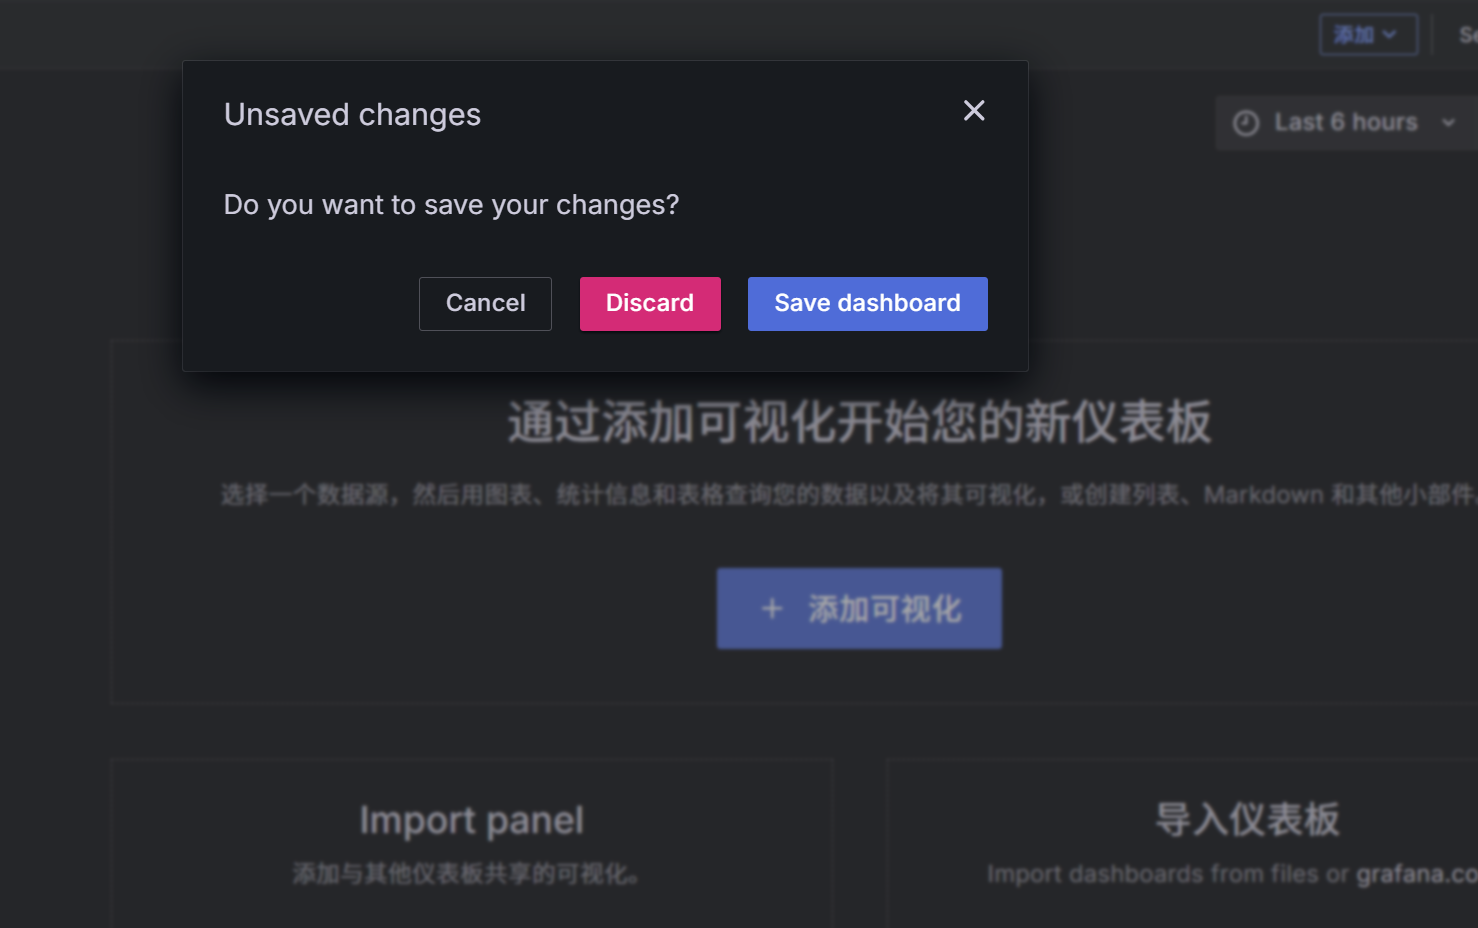
导入仪表板
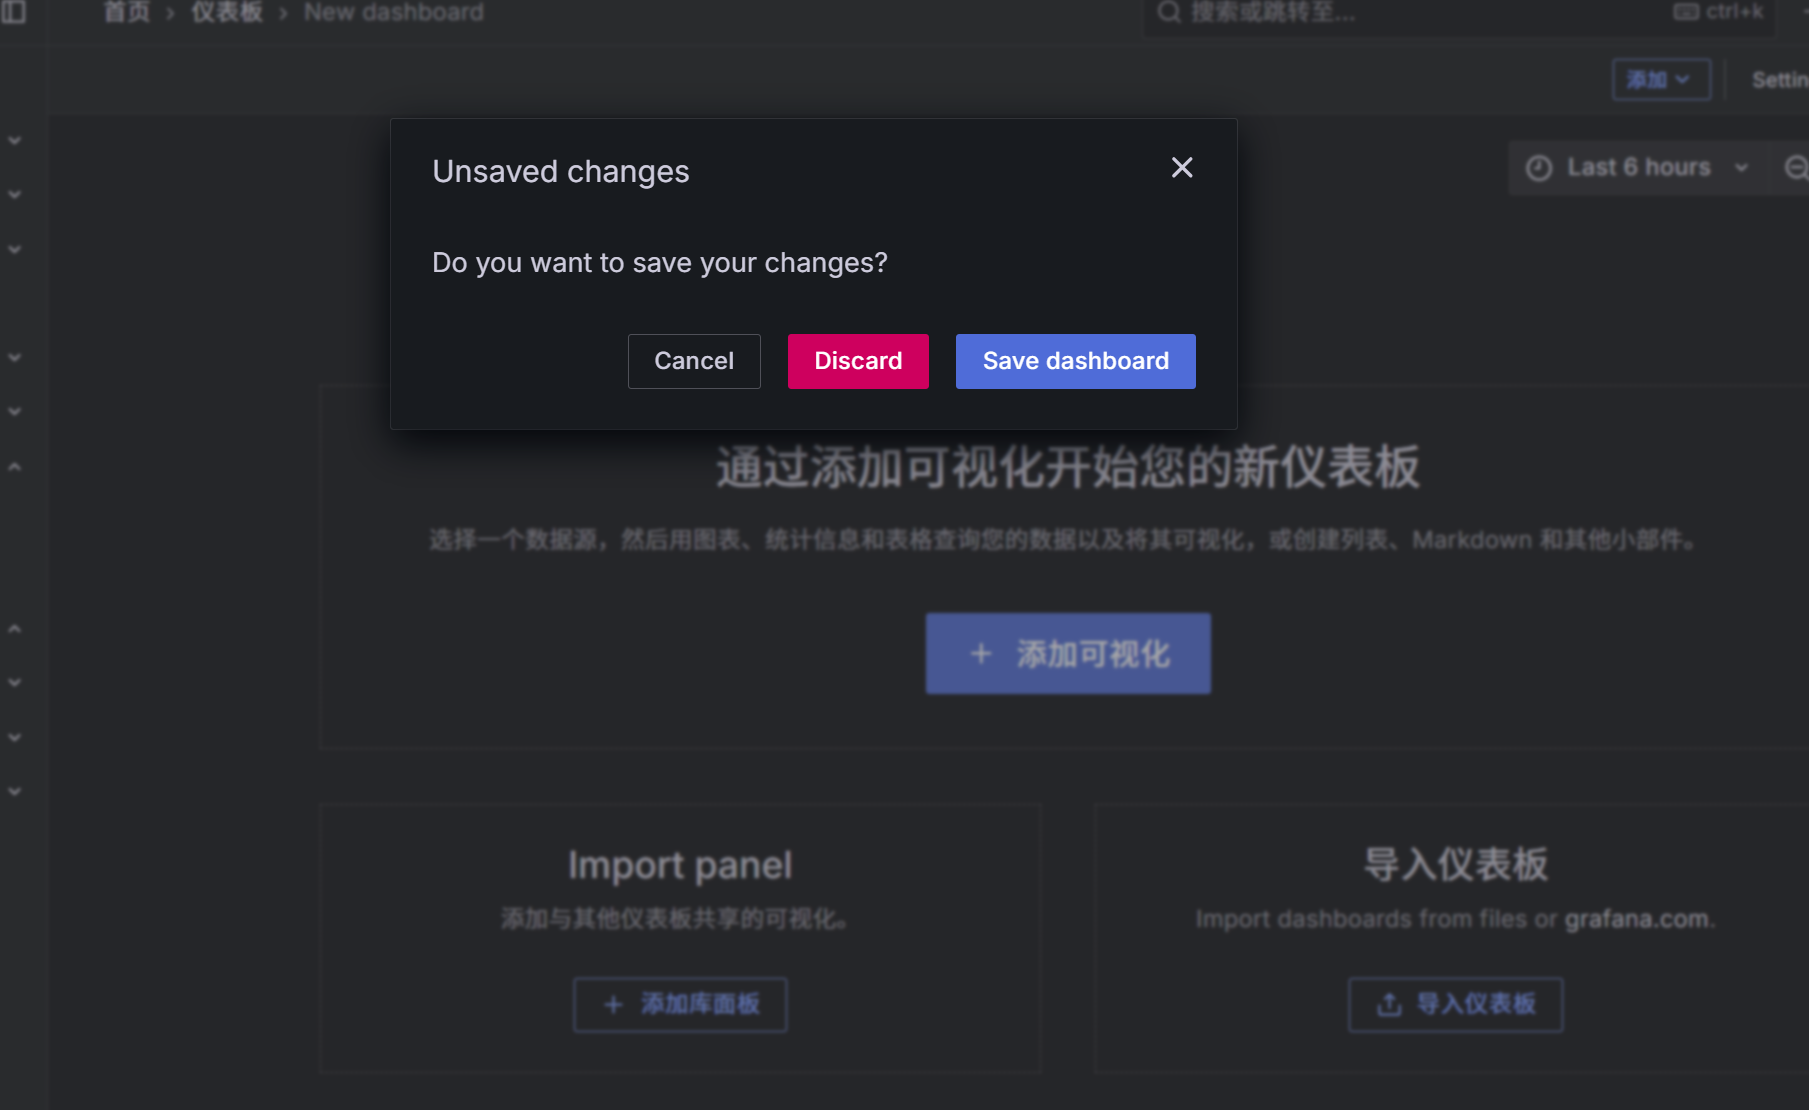
然后Discard
然后与上面操作一样
注意:页面刷新一下才会显示出来
这里面可以编辑
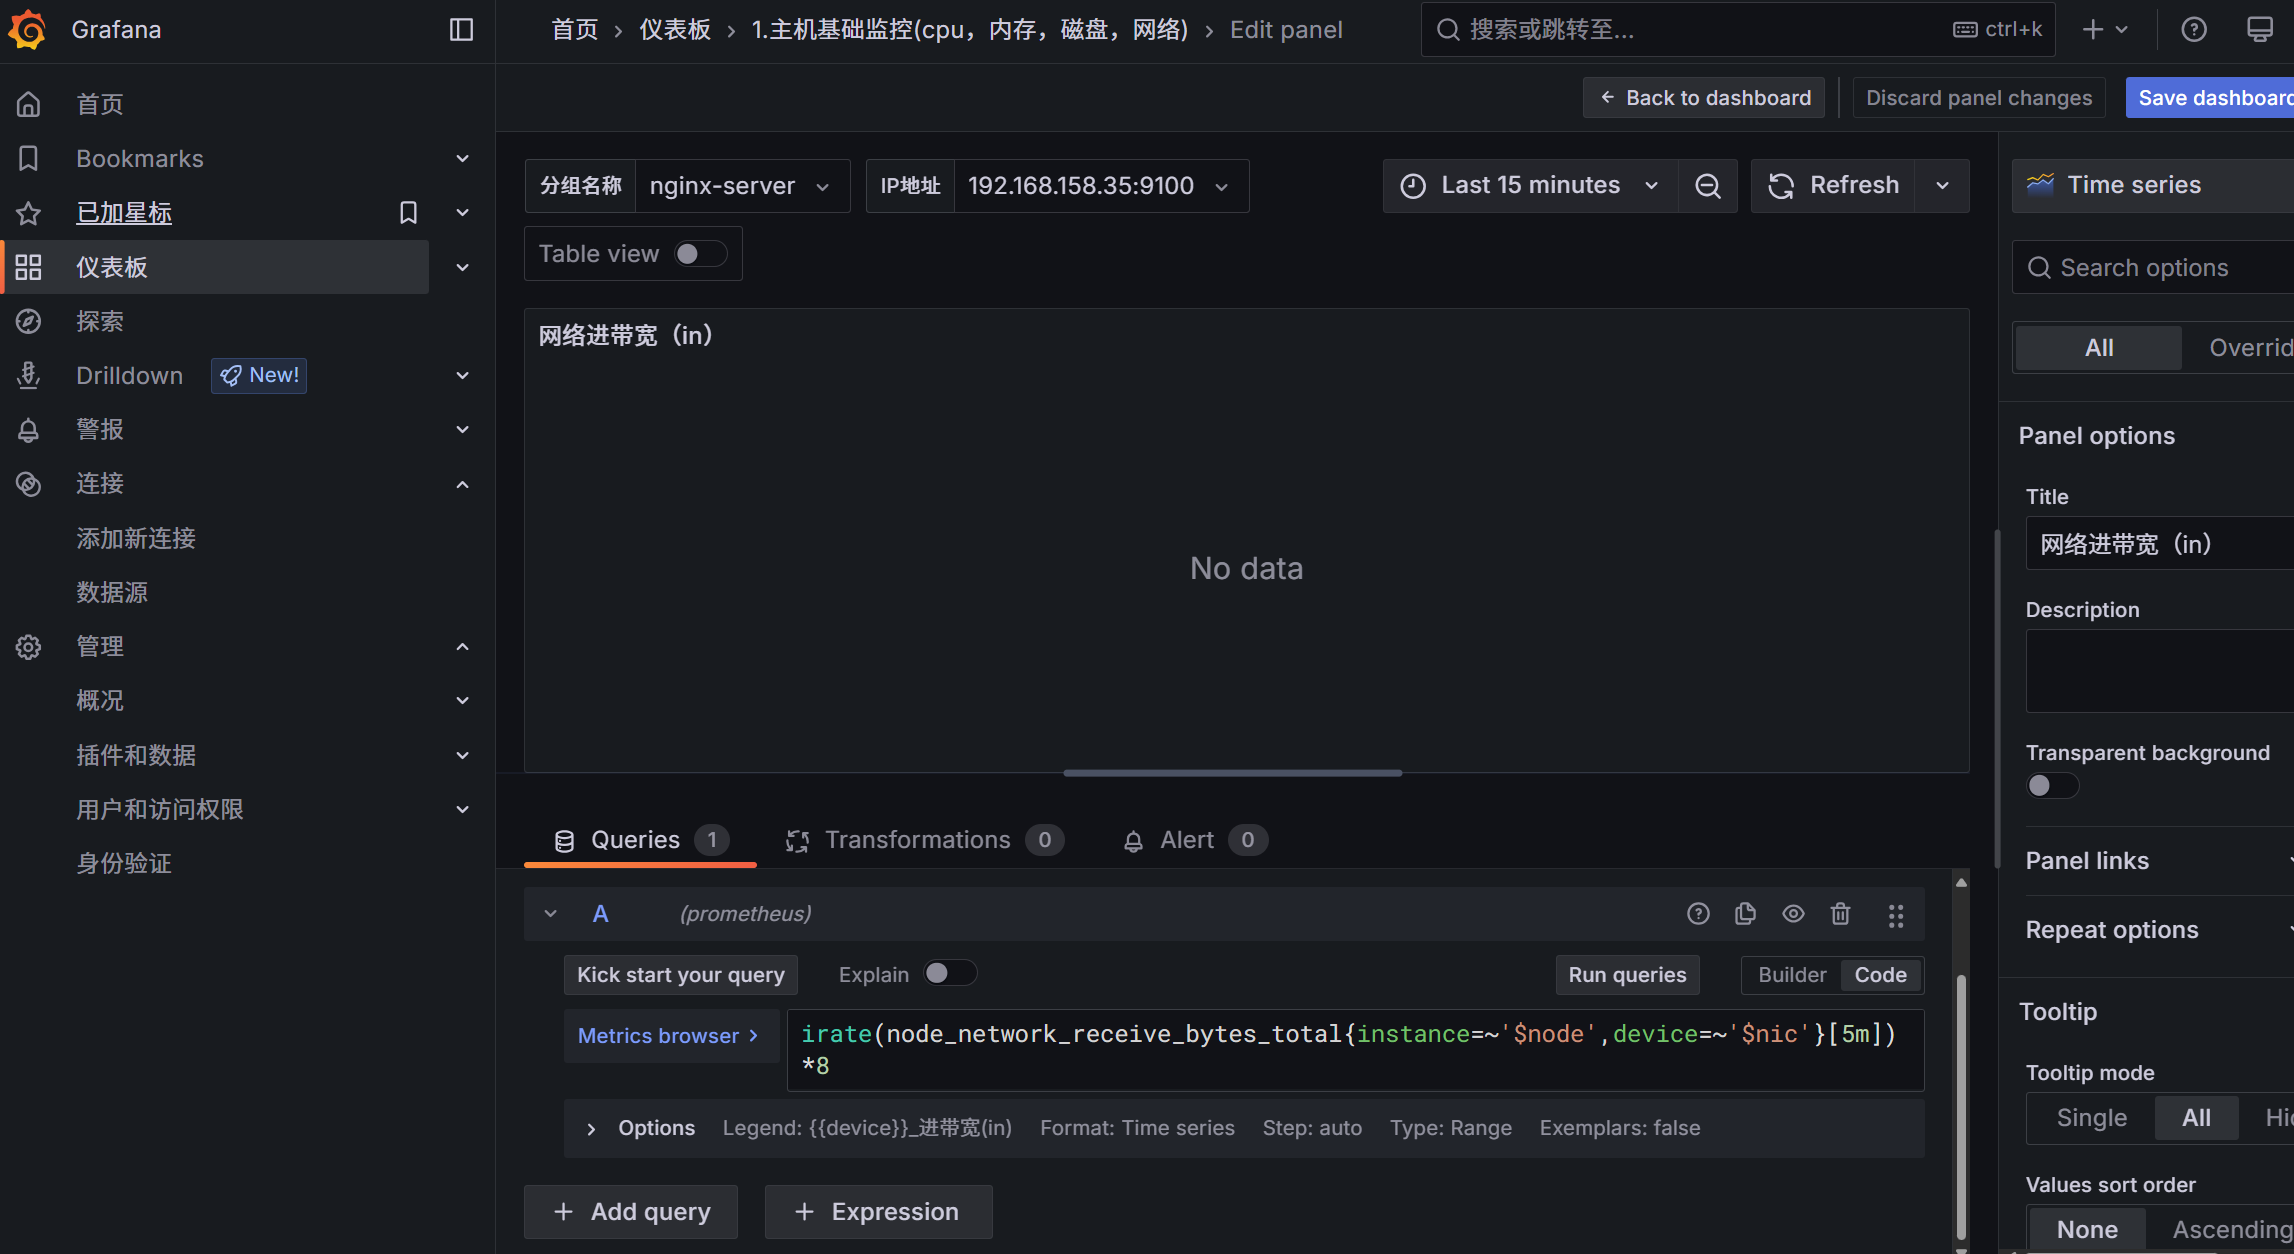
注意:这个插件装不上去

二、监控一个服务:mysql
要监控mysql需要两个条件,一个是系统中有mysql,另一个是要有监控插件,现在监控插件已经下载好了,所以我们要先安装mysql,然后进行相应的授权,让插件可以获取到所需要的信息,然后再设置相关插件,修改prometheus配置文件
一、部署mysql业务
192.168.158.36
安装mysql-server并启用mysql
[root@localhost ~]# yum -y install mysql-server
[root@localhost ~]# systemctl start mysqld
创建监控用户
[root@localhost mysqld_exporter-0.16.0.linux-amd64]# mysql
Welcome to the MySQL monitor.  Commands end with ; or \g.
Your MySQL connection id is 9
Server version: 8.0.43 Source distribution

Copyright (c) 2000, 2025, Oracle and/or its affiliates.

Oracle is a registered trademark of Oracle Corporation and/or its
affiliates. Other names may be trademarks of their respective
owners.

Type 'help;' or '\h' for help. Type '\c' to clear the current input statement.

mysql> create user 'mysql'@'localhost' identified by '123.com';
Query OK, 0 rows affected (0.00 sec)

mysql> GRANT SELECT ON *.* TO 'mysql'@'localhost';
Query OK, 0 rows affected (0.00 sec)

mysql> flush privileges;
Query OK, 0 rows affected (0.00 sec)

mysql> exit
Bye
二、部署监控插件
[root@localhost ~]# ls
anaconda-ks.cfg  mysqld_exporter-0.16.0.linux-amd64.tar.gz
[root@localhost ~]# tar xf mysqld_exporter-0.16.0.linux-amd64.tar.gz
[root@localhost ~]# cd mysqld_exporter-0.16.0.linux-amd64/
[root@localhost mysqld_exporter-0.16.0.linux-amd64]# ls
LICENSE  mysqld_exporter  NOTICE
[root@localhost mysqld_exporter-0.16.0.linux-amd64]# vim .my.cnf
[root@localhost mysqld_exporter-0.16.0.linux-amd64]# cat .my.cnf
[client]
user=mysql
password=123.com
启动
记住端口号是9104
[root@localhost mysqld_exporter-0.16.0.linux-amd64]# nohup ./mysqld_exporter &
[2] 68116
[root@localhost mysqld_exporter-0.16.0.linux-amd64]# nohup: 忽略输入并把输出追加到 'nohup.out'

[2]+  退出 1                nohup ./mysqld_exporter
[root@localhost mysqld_exporter-0.16.0.linux-amd64]# netstat -anptu | grep mysqld
tcp6       0      0 :::9104                 :::*                    LISTEN      67405/.//mysqld_exp
tcp6       0      0 :::3306                 :::*                    LISTEN      67689/mysqld
tcp6       0      0 :::33060                :::*                    LISTEN      67689/mysqld
回到prometheus主机
修改prometheus.yml主配置文件
添加,然后保存退出
  - job_name: "mysql-server"
    static_configs:
      - targets: ["192.168.158.36:9104"]
重启prometheus
[root@prometheus prometheus]# killall prometheus
[root@prometheus prometheus]# nohup prometheus --config.file=/usr/local/prometheus/prometheus.yml &
[5] 70564
[4]   已完成               nohup prometheus --config.file=/usr/local/prometheus/prometheus.yml
[root@prometheus prometheus]# nohup: 忽略输入并把输出追加到 'nohup.out'

[root@prometheus prometheus]#
回到监控页面
新建仪表板
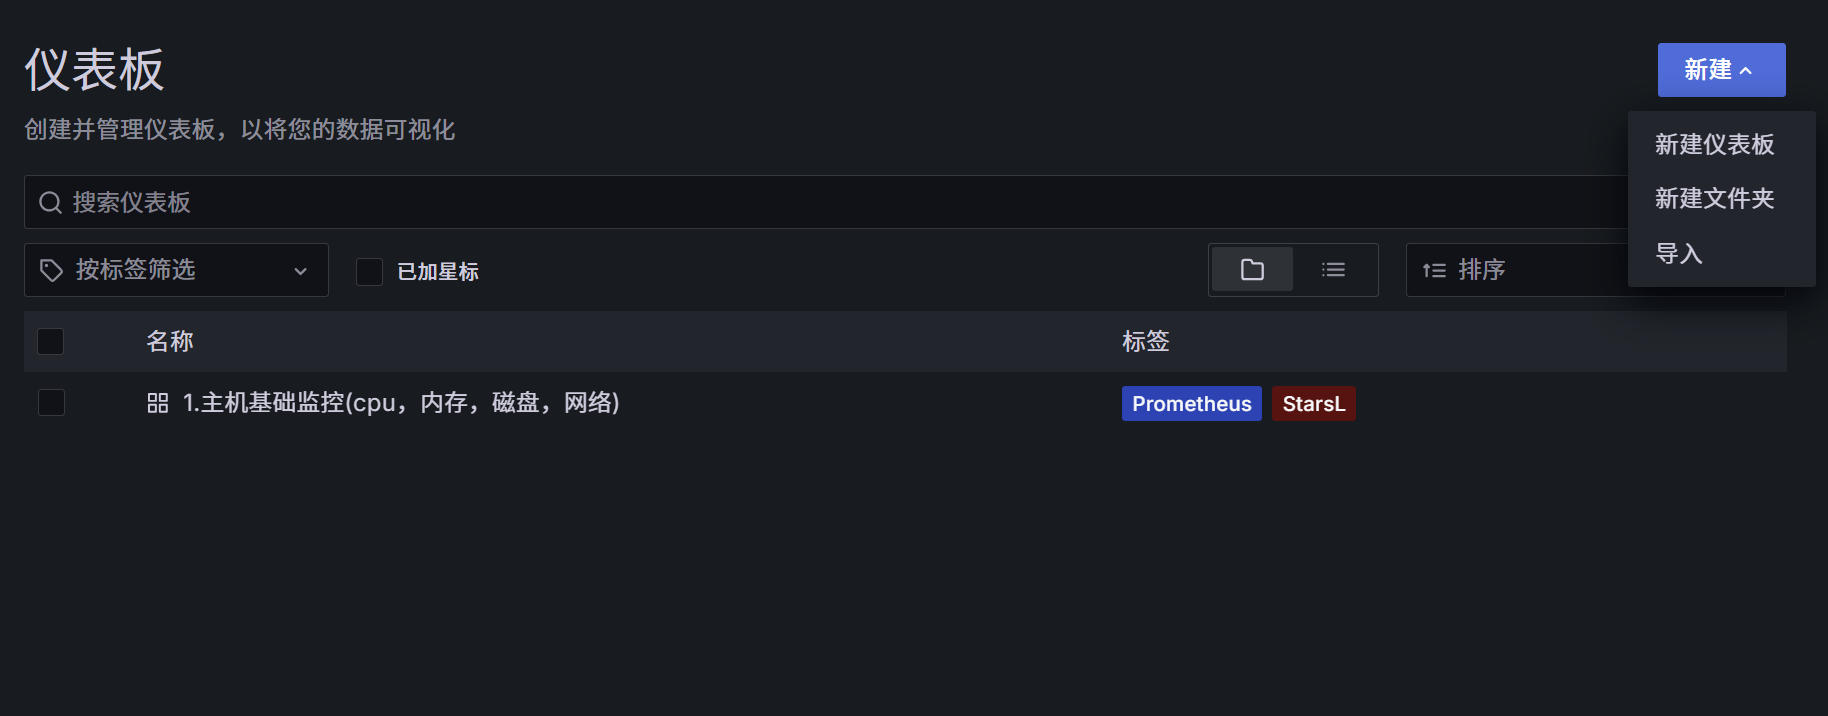
导入仪表板
选择Discard
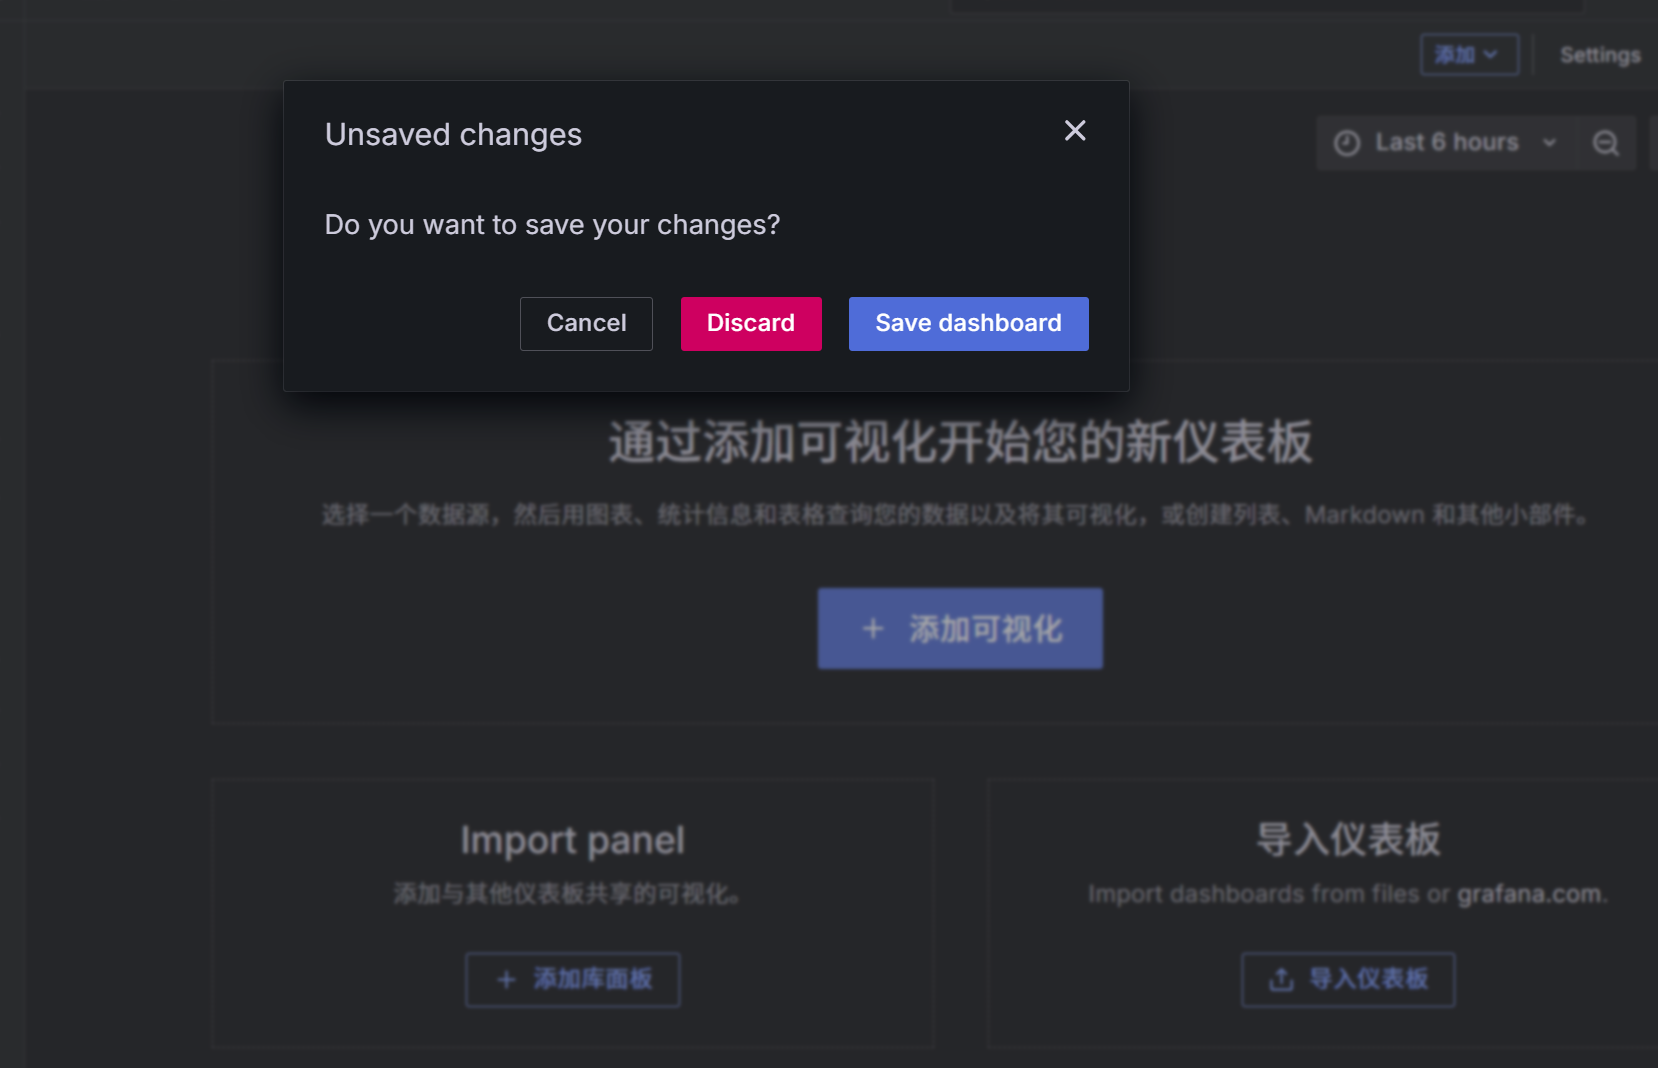
上传仪表板模板 JSON文件
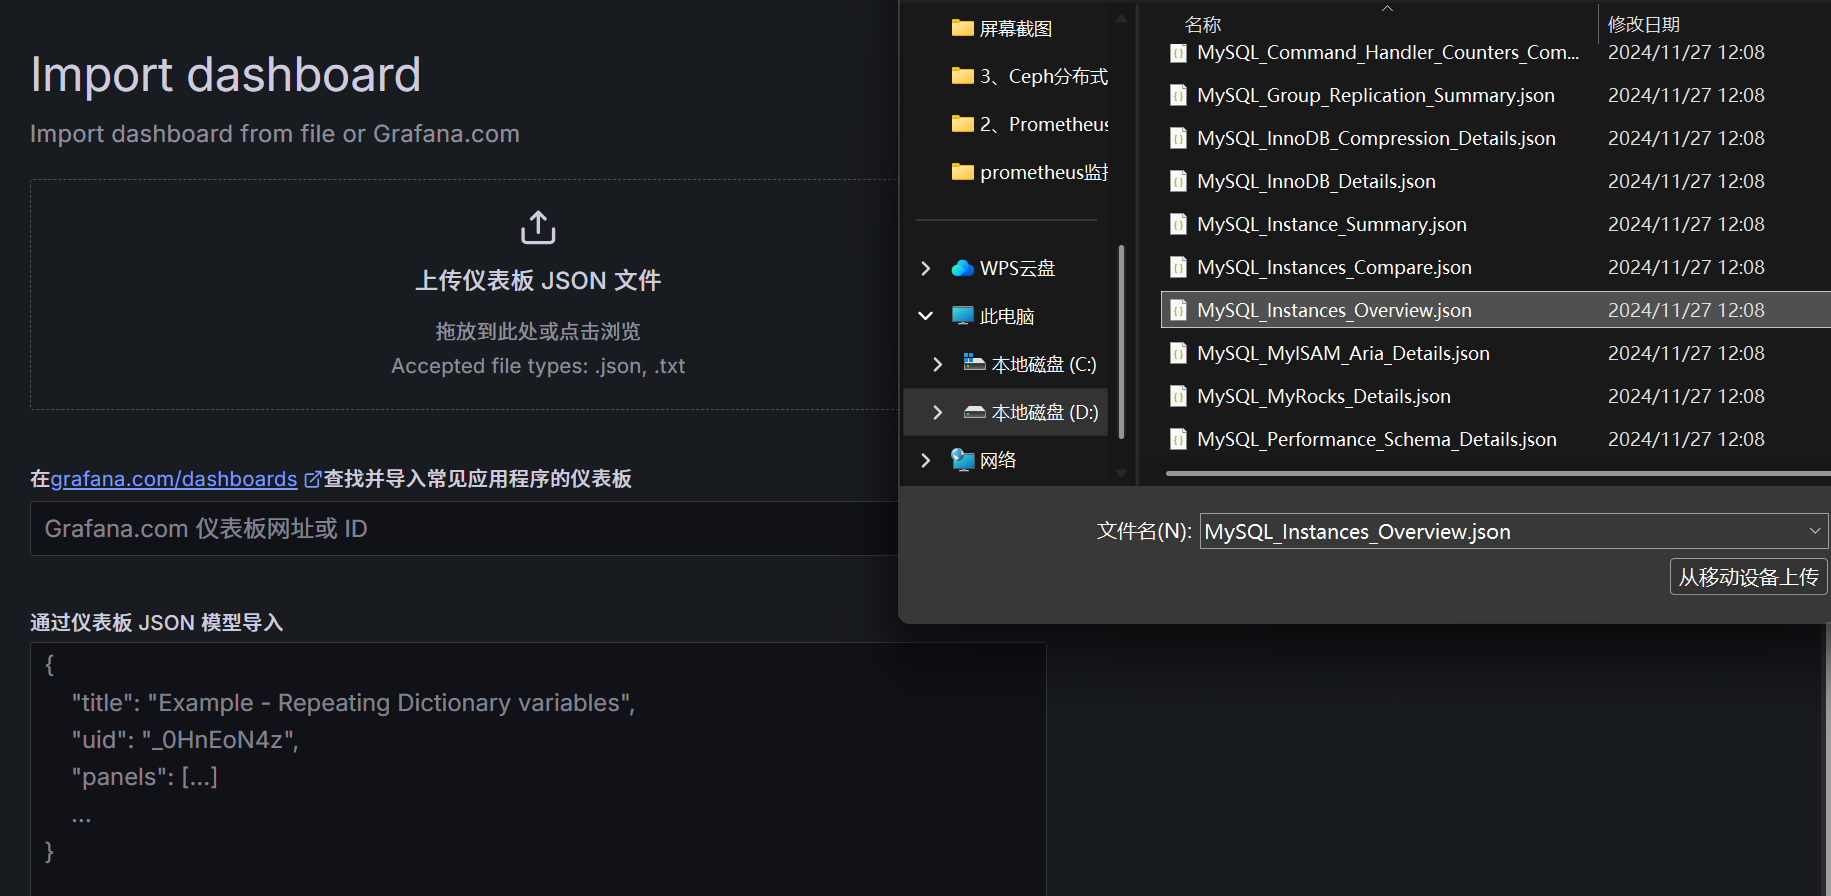
选择 Import(导入)
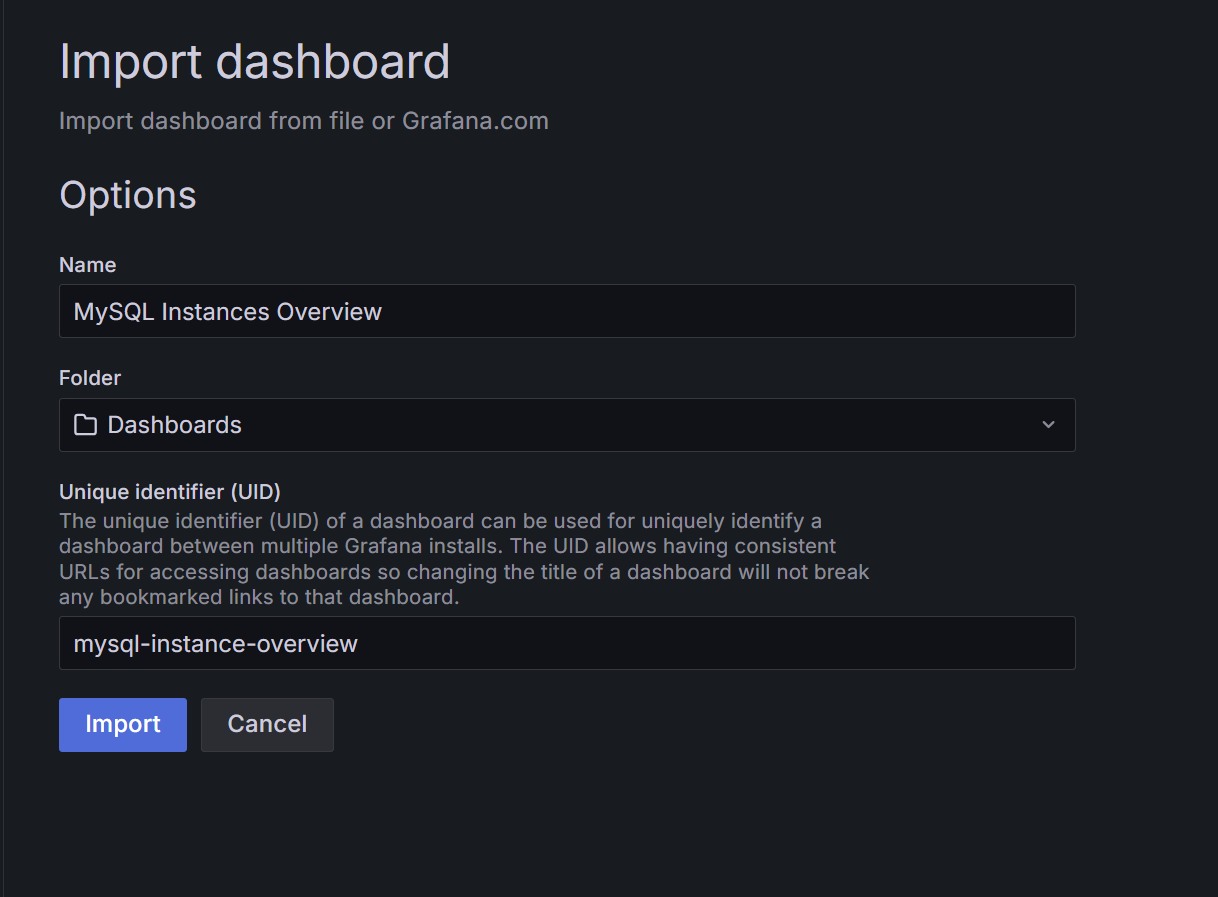
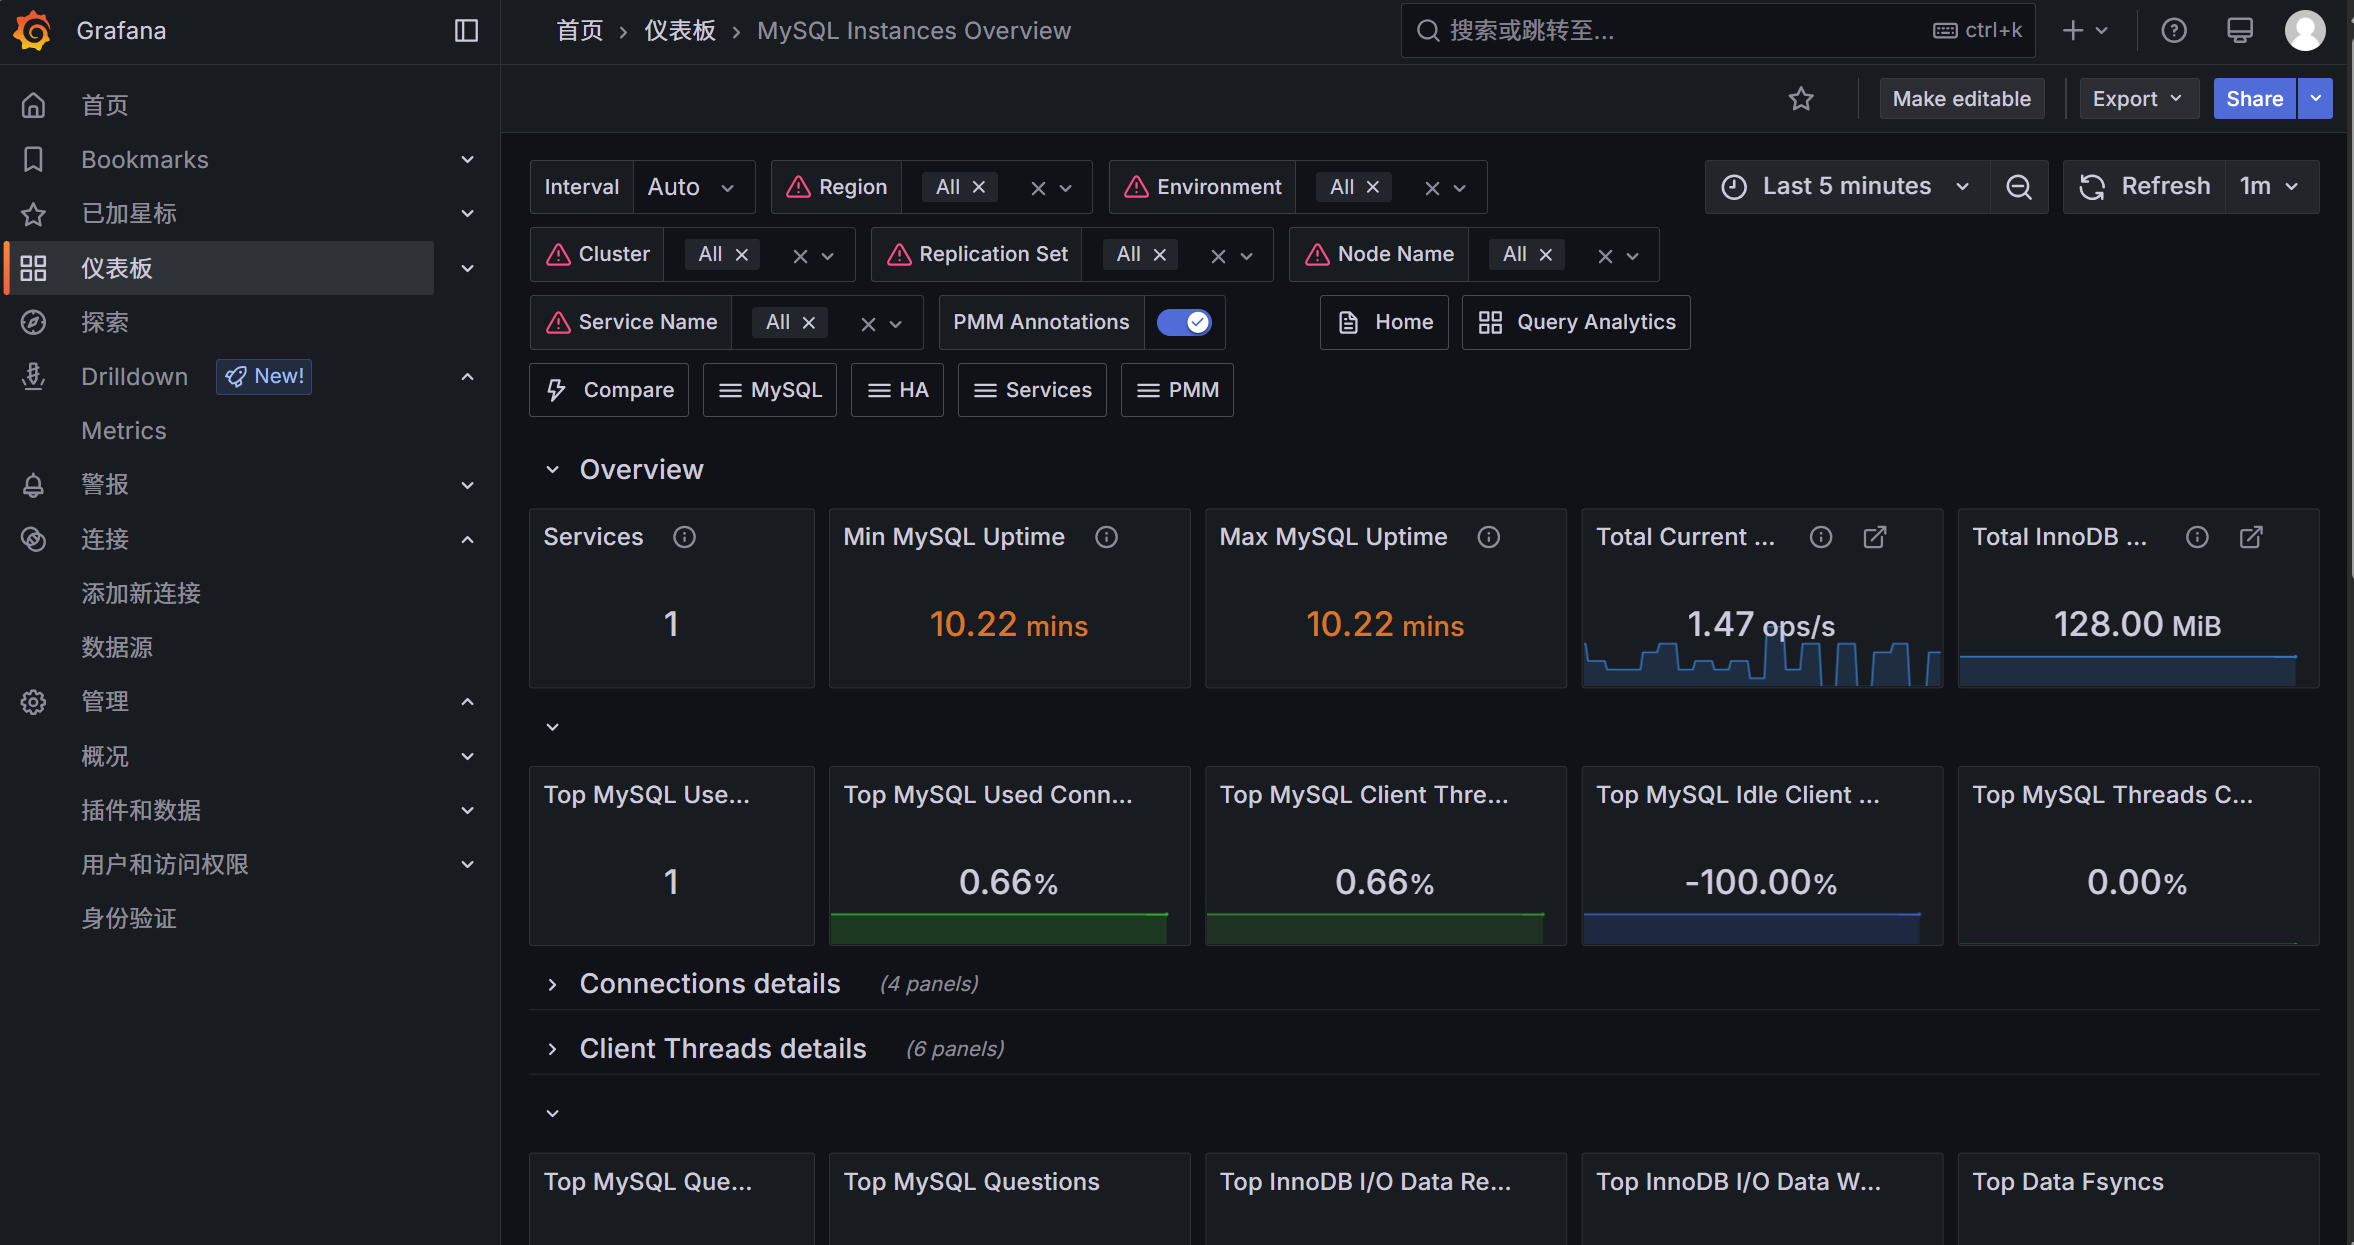
就能看到prometheus监控192.168.158.36mysql服务的数据了
三、配置alertmanager告警
主机:192.168.158.14
1、部署alertmanager
安装
alertmanager-0.28.1.linux-amd64.tar.gz
[root@prometheus ~]# tar xf alertmanager-0.28.1.linux-amd64.tar.gz 2、配置alertmanager.yml文件
[root@prometheus ~]# mv alertmanager-0.28.1.linux-amd64 /usr/local/alertmanager
[root@prometheus ~]# cd /usr/local/alertmanager/
[root@prometheus alertmanager]# vim alertmanager.yml
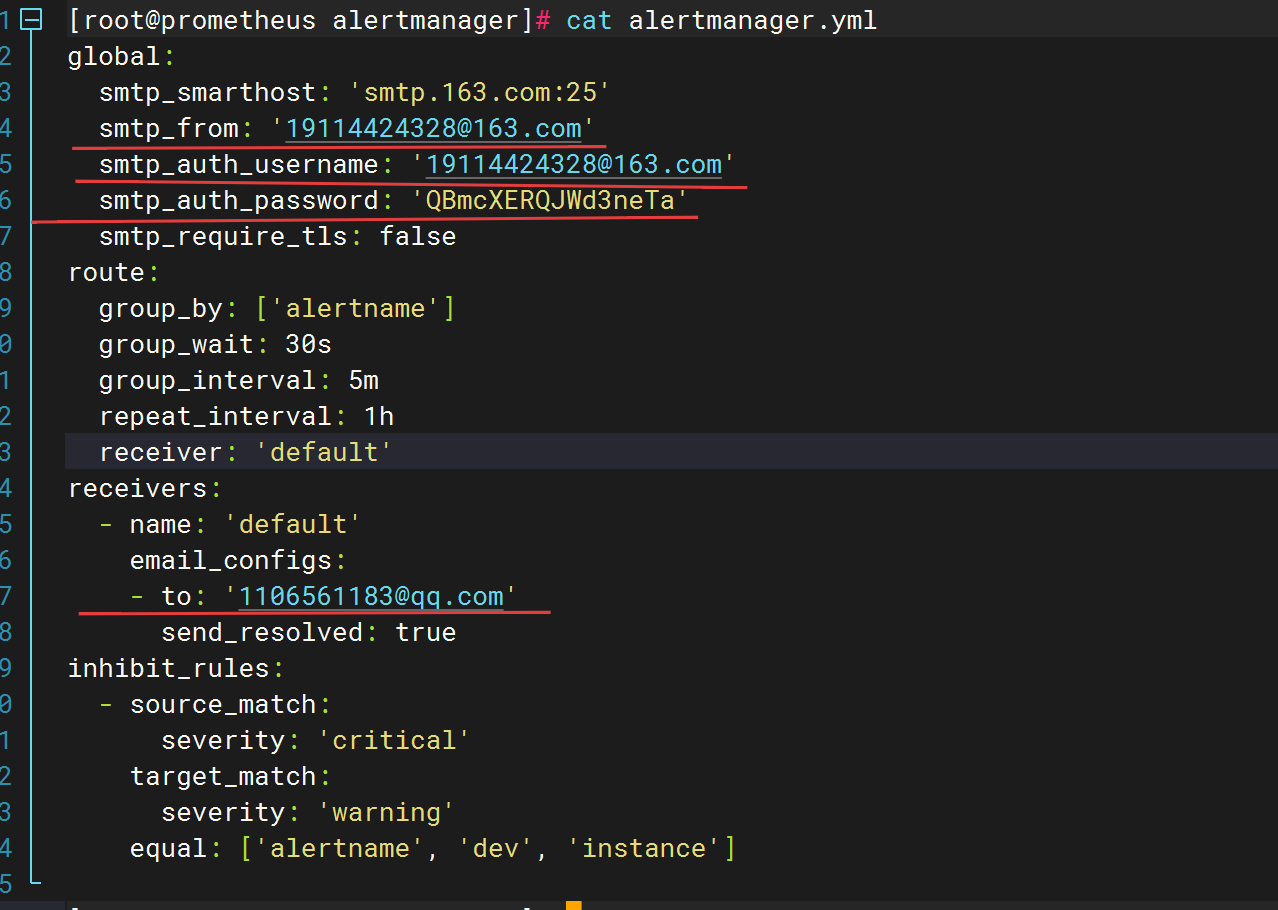
[root@prometheus alertmanager]# cat alertmanager.yml
global:
smtp_smarthost: 'smtp.163.com:25'
smtp_from: '19114424328@163.com'
smtp_auth_username: '19114424328@163.com'
smtp_auth_password: 'QBmcXERQJWd3neTa'
smtp_require_tls: false
route:
group_by: ['alertname']
group_wait: 30s
group_interval: 5m
repeat_interval: 1h
receiver: 'default'
receivers:
- name: 'default'
email_configs:
- to: '1106561183@qq.com'
send_resolved: true
inhibit_rules:
- source_match:
severity: 'critical'
target_match:
severity: 'warning'
equal: ['alertname', 'dev', 'instance']
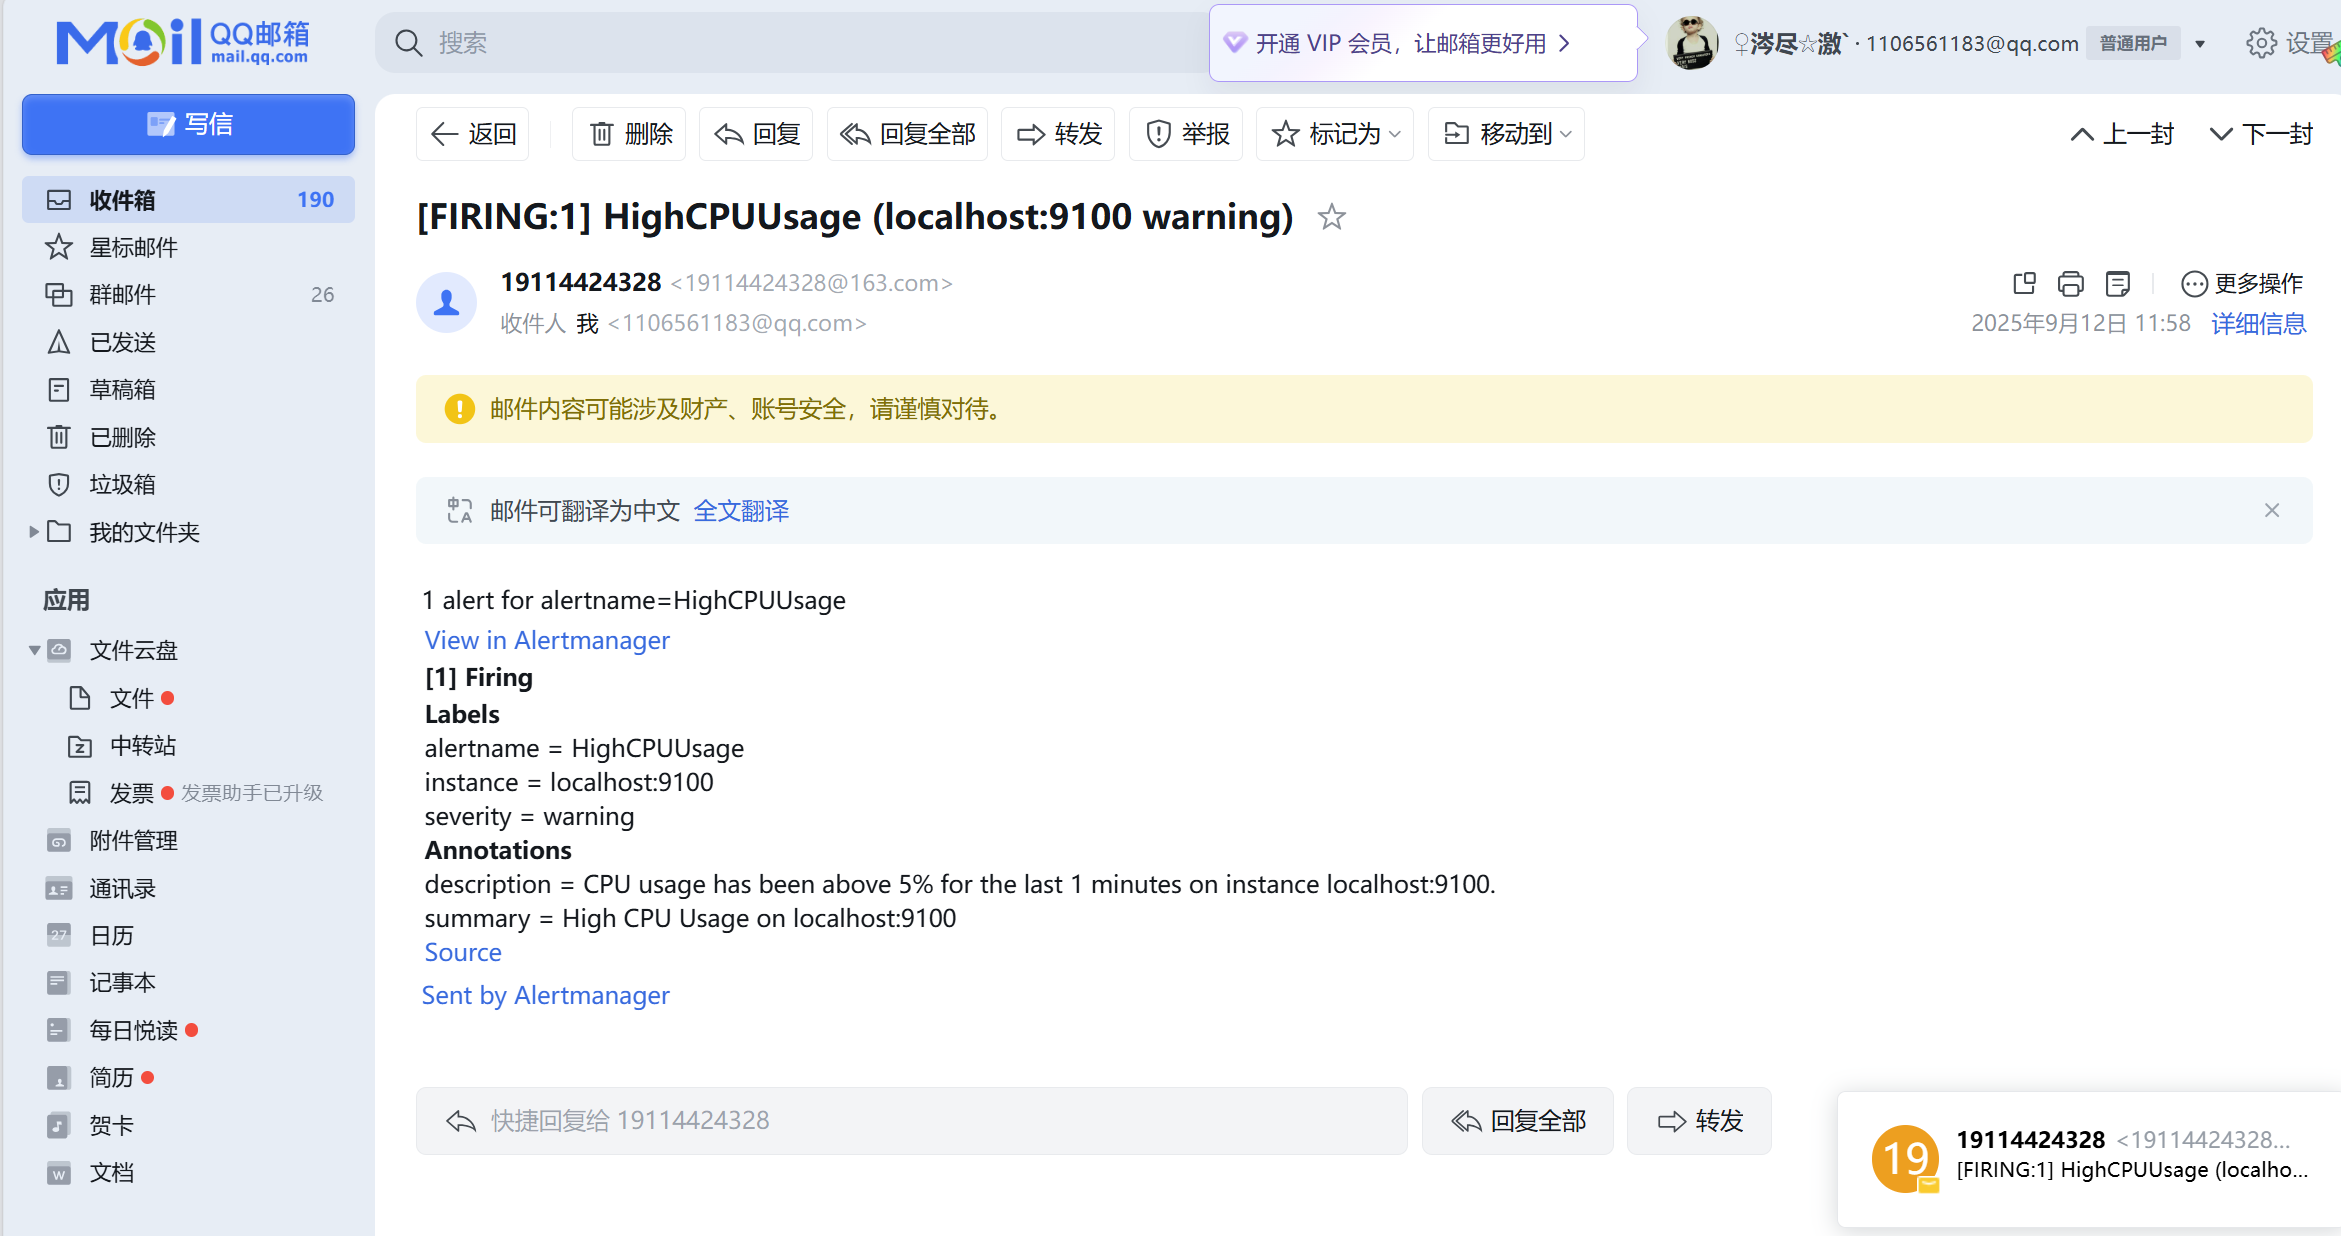
通过'19114424328@163.com'邮箱,告警信息发送给'1106561183@qq.com'邮箱
启动服务
alertmanager监听的是9093号端口
[root@prometheus alertmanager]# pwd
/usr/local/alertmanager
[root@prometheus alertmanager]# nohup ./alertmanager --web.listen-address=:9093 --config.file=/usr/local/alertmanager/alertmanager.yml &
[6] 89185
[root@prometheus alertmanager]# nohup: 忽略输入并把输出追加到 'nohup.out'

[root@prometheus alertmanager]# ls
alertmanager  alertmanager.yml  alertmanager.yml.back  amtool  data  LICENSE  nohup.out  NOTICE
[root@prometheus alertmanager]# netstat -anptu | grep alert
tcp6       0      0 :::9094                 :::*                    LISTEN      89185/./alertmanage
tcp6       0      0 :::9093                 :::*                    LISTEN      89185/./alertmanage
udp6       0      0 :::9094                 :::*                                89185/./alertmanage
访问web页面
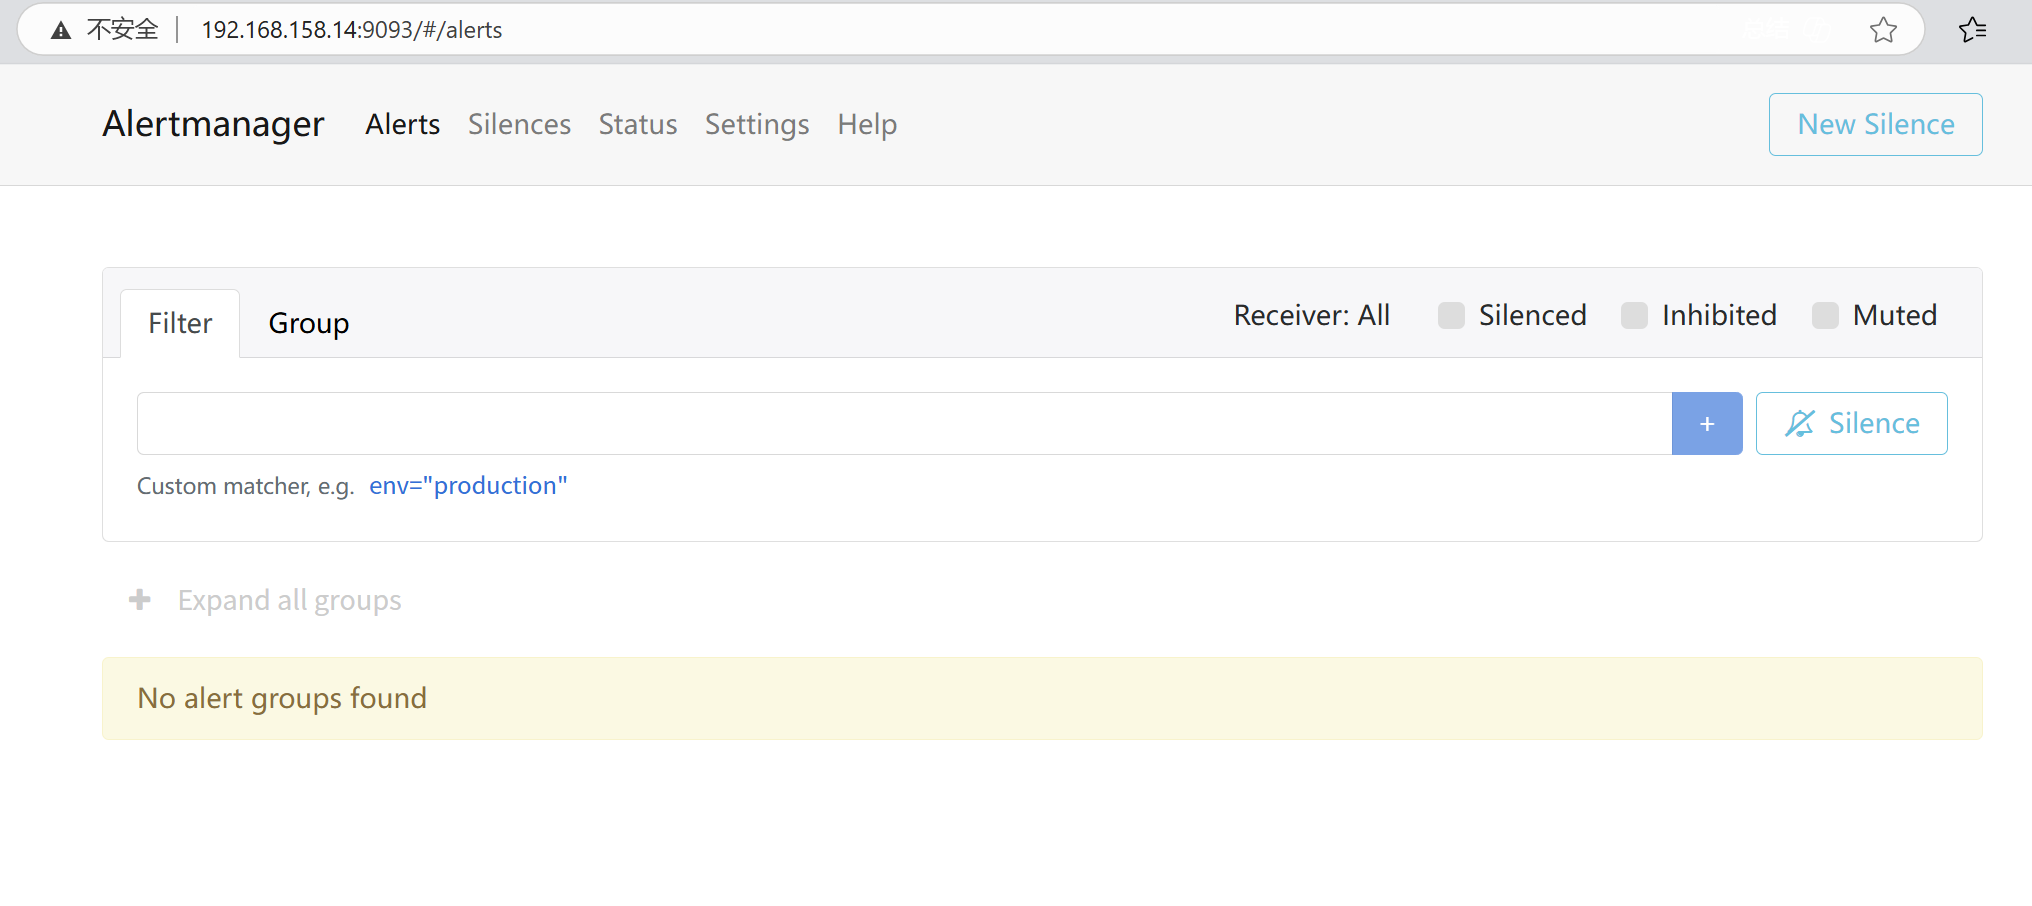
---------------------------------

---------------------------------------------
3、在prometheus指向Alertmanager
在配置文件中修改如下配置,然后重新加载prometheus即可!
192.168.158.14主机操作
修改prometheus主配置文件
alertmanager在那台主机就写哪个ip,本机就写localhost
rule_files配置模块
指向 告警规则文件的路径
[root@prometheus alertmanager]# vim /usr/local/prometheus/prometheus.yml
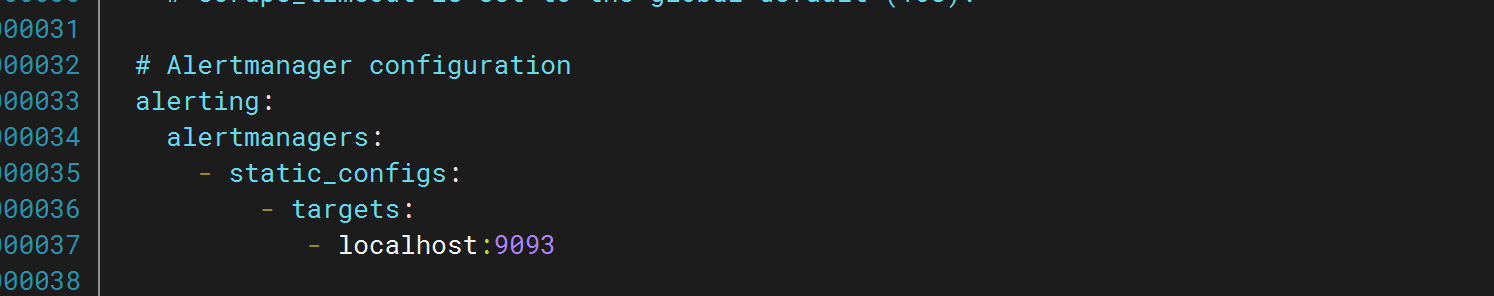
alerting:
alertmanagers:
- static_configs:
- targets:
- localhost:9093
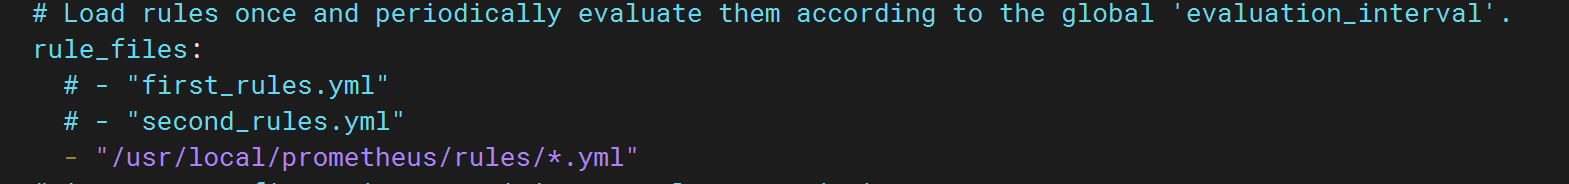
# Load rules once and periodically evaluate them according to the global 'evaluation_interval'.
rule_files:
- "/usr/local/prometheus/rules/*.yml" alertmanager在本机上,所以这里是本机 localhost:9093
告警规则文件路径
添加
        labels:
          app: "prometheus"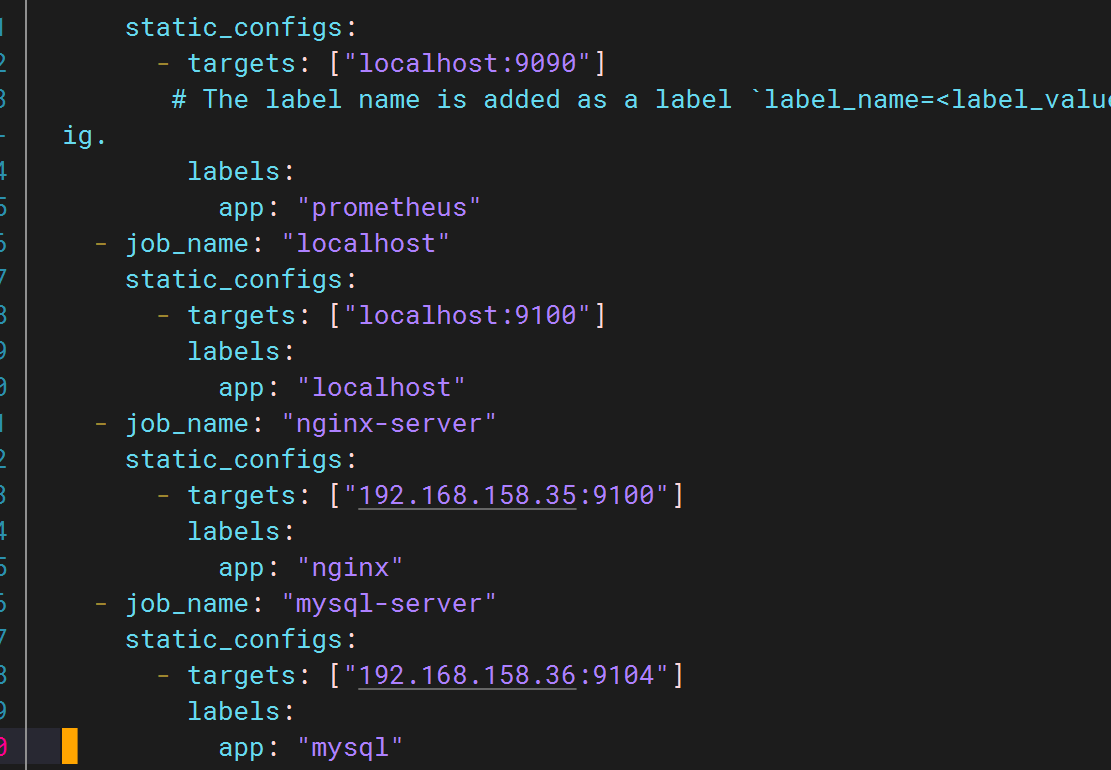
重新加载配置
[root@prometheus alertmanager]# killall prometheus
[root@prometheus alertmanager]# netstat -anptu | grep 9090
tcp6       0      0 ::1:50962               ::1:9090                TIME_WAIT   -
[root@prometheus alertmanager]# nohup prometheus --config.file=/usr/local/prometheus/prometheus.yml &
[7] 93882
[root@prometheus alertmanager]# nohup: 忽略输入并把输出追加到 'nohup.out'

[root@prometheus alertmanager]# netstat -anptu | grep 9090
tcp6       0      0 :::9090                 :::*                    LISTEN      93882/prometheus
tcp6       0      0 ::1:50962               ::1:9090                TIME_WAIT   -
4、定义告警规则
创建/usr/local/prometheus/rules目录
在 prometheus.yml 中通过 rule_files 配置项来指定步骤1中创建的规则文件的路径。
[root@prometheus prometheus]# cd /usr/local/prometheus/
[root@prometheus prometheus]# ls
data LICENSE nohup.out NOTICE prometheus prometheus.yml promtool
[root@prometheus prometheus]# mkdir -p rules
[root@prometheus prometheus]# ls
data LICENSE nohup.out NOTICE prometheus prometheus.yml promtool rules
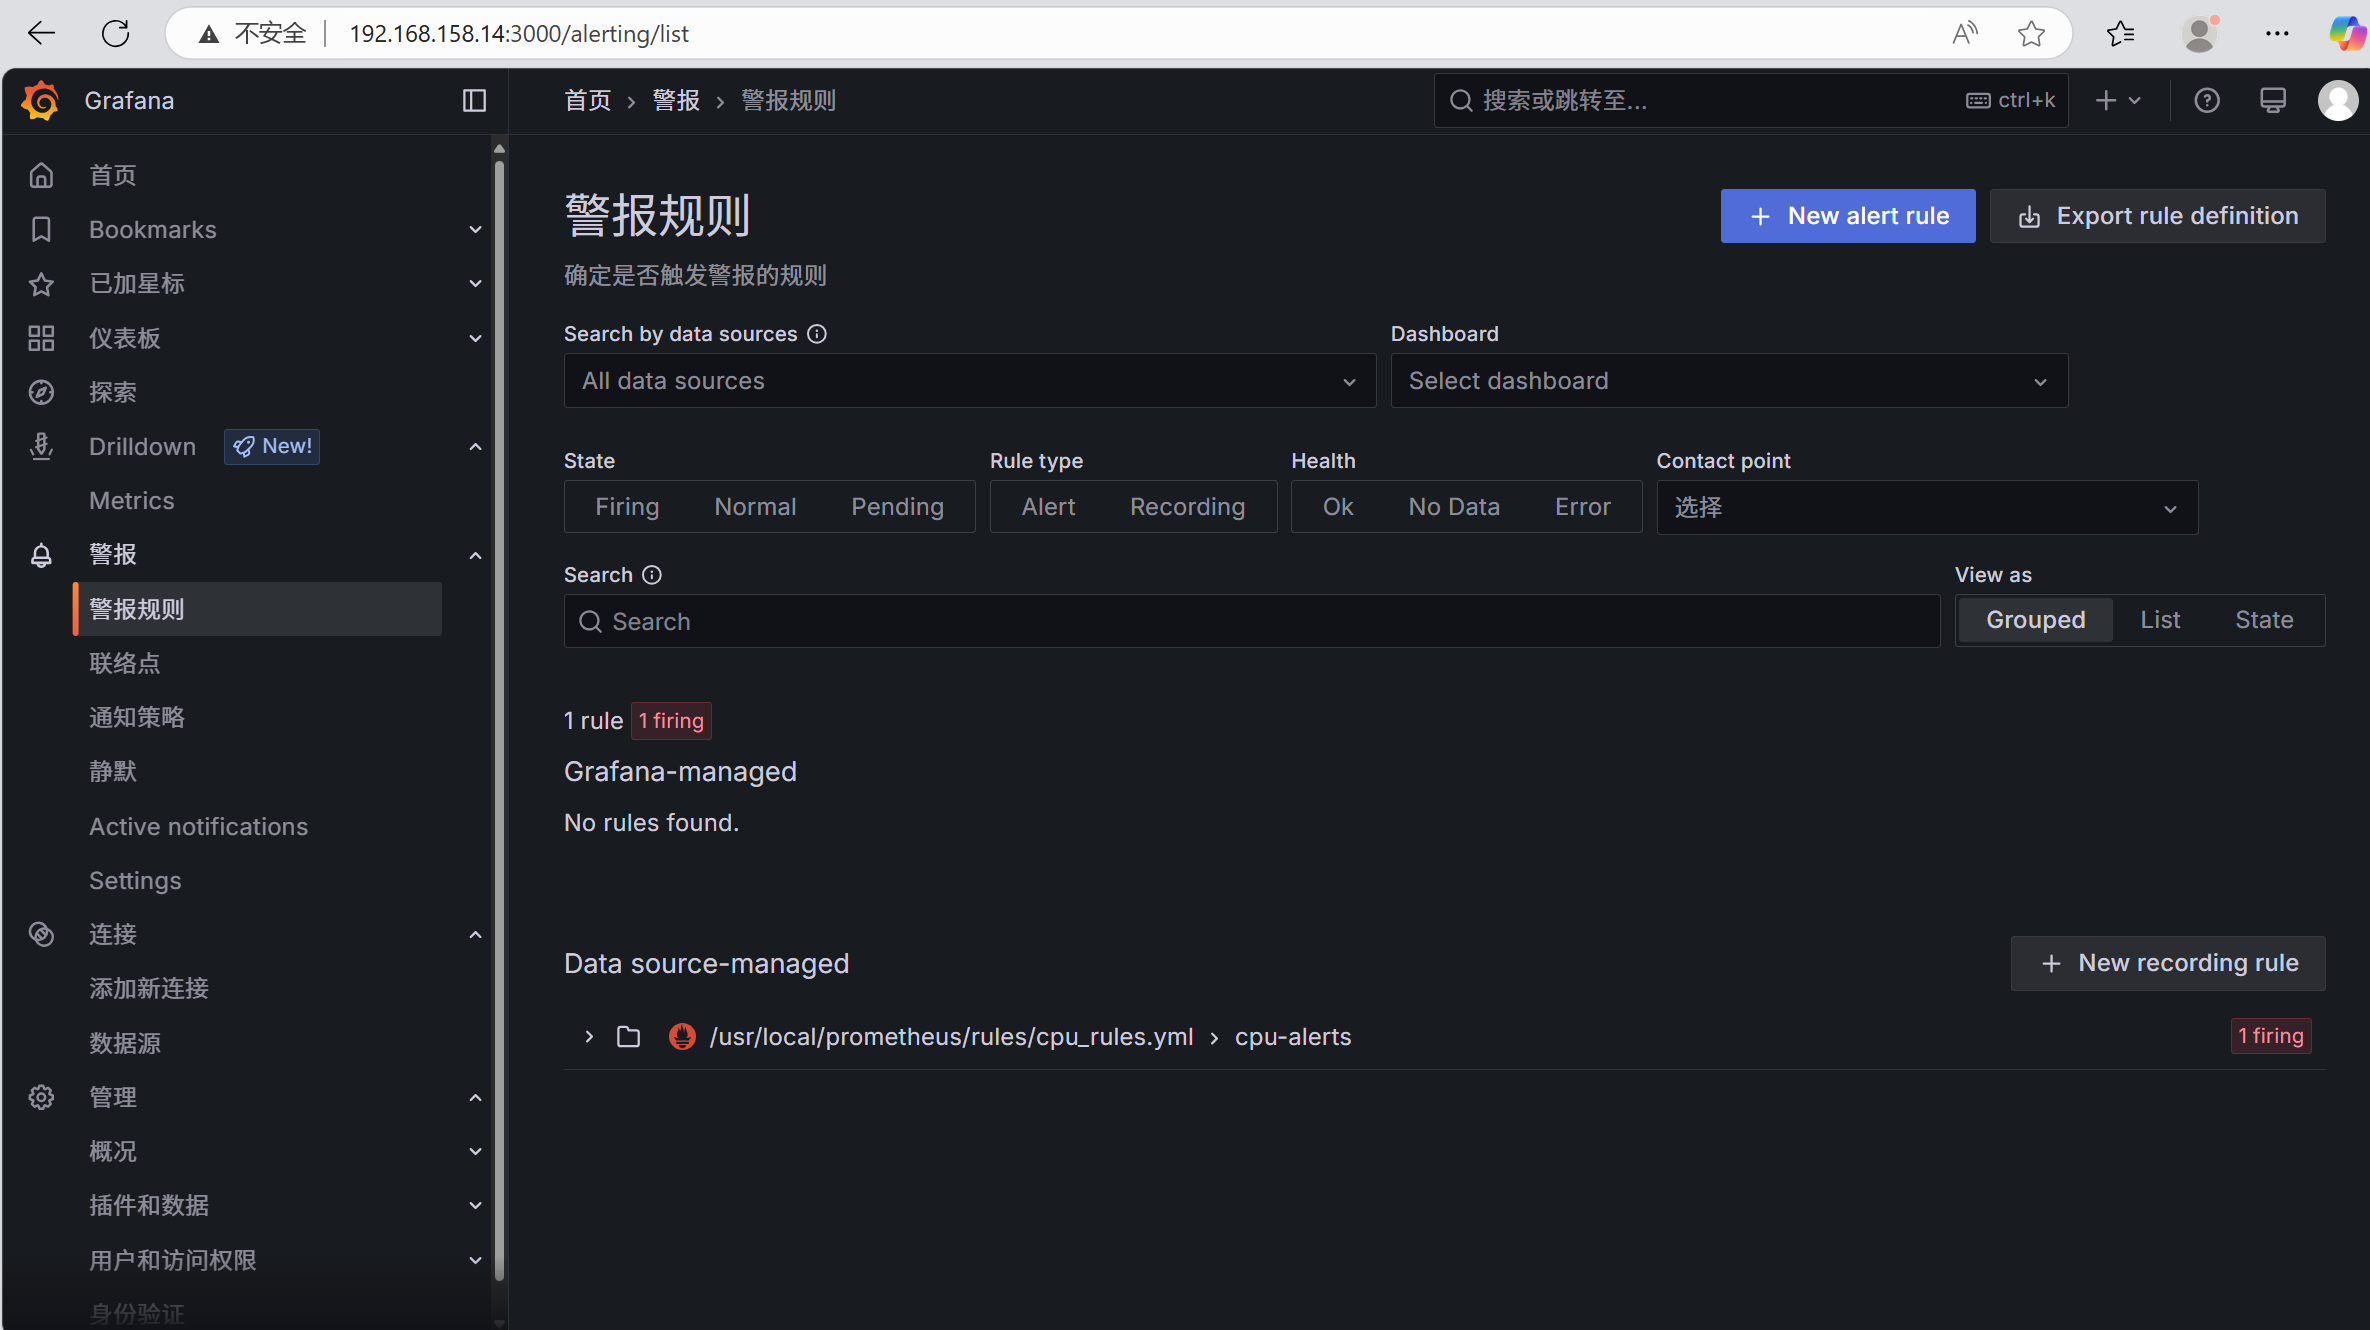
[root@prometheus prometheus]# cd rules/创建告警规则文件
(注意,创建告警规则文件的路径要与prometheus.yml文件里的告警规则路径一致)
在你的 Prometheus 服务器上,选择一个合适的目录来存放规则文件,通常与 prometheus.yml 在同一目录或附近
groups:
- name: cpu-alerts
rules:
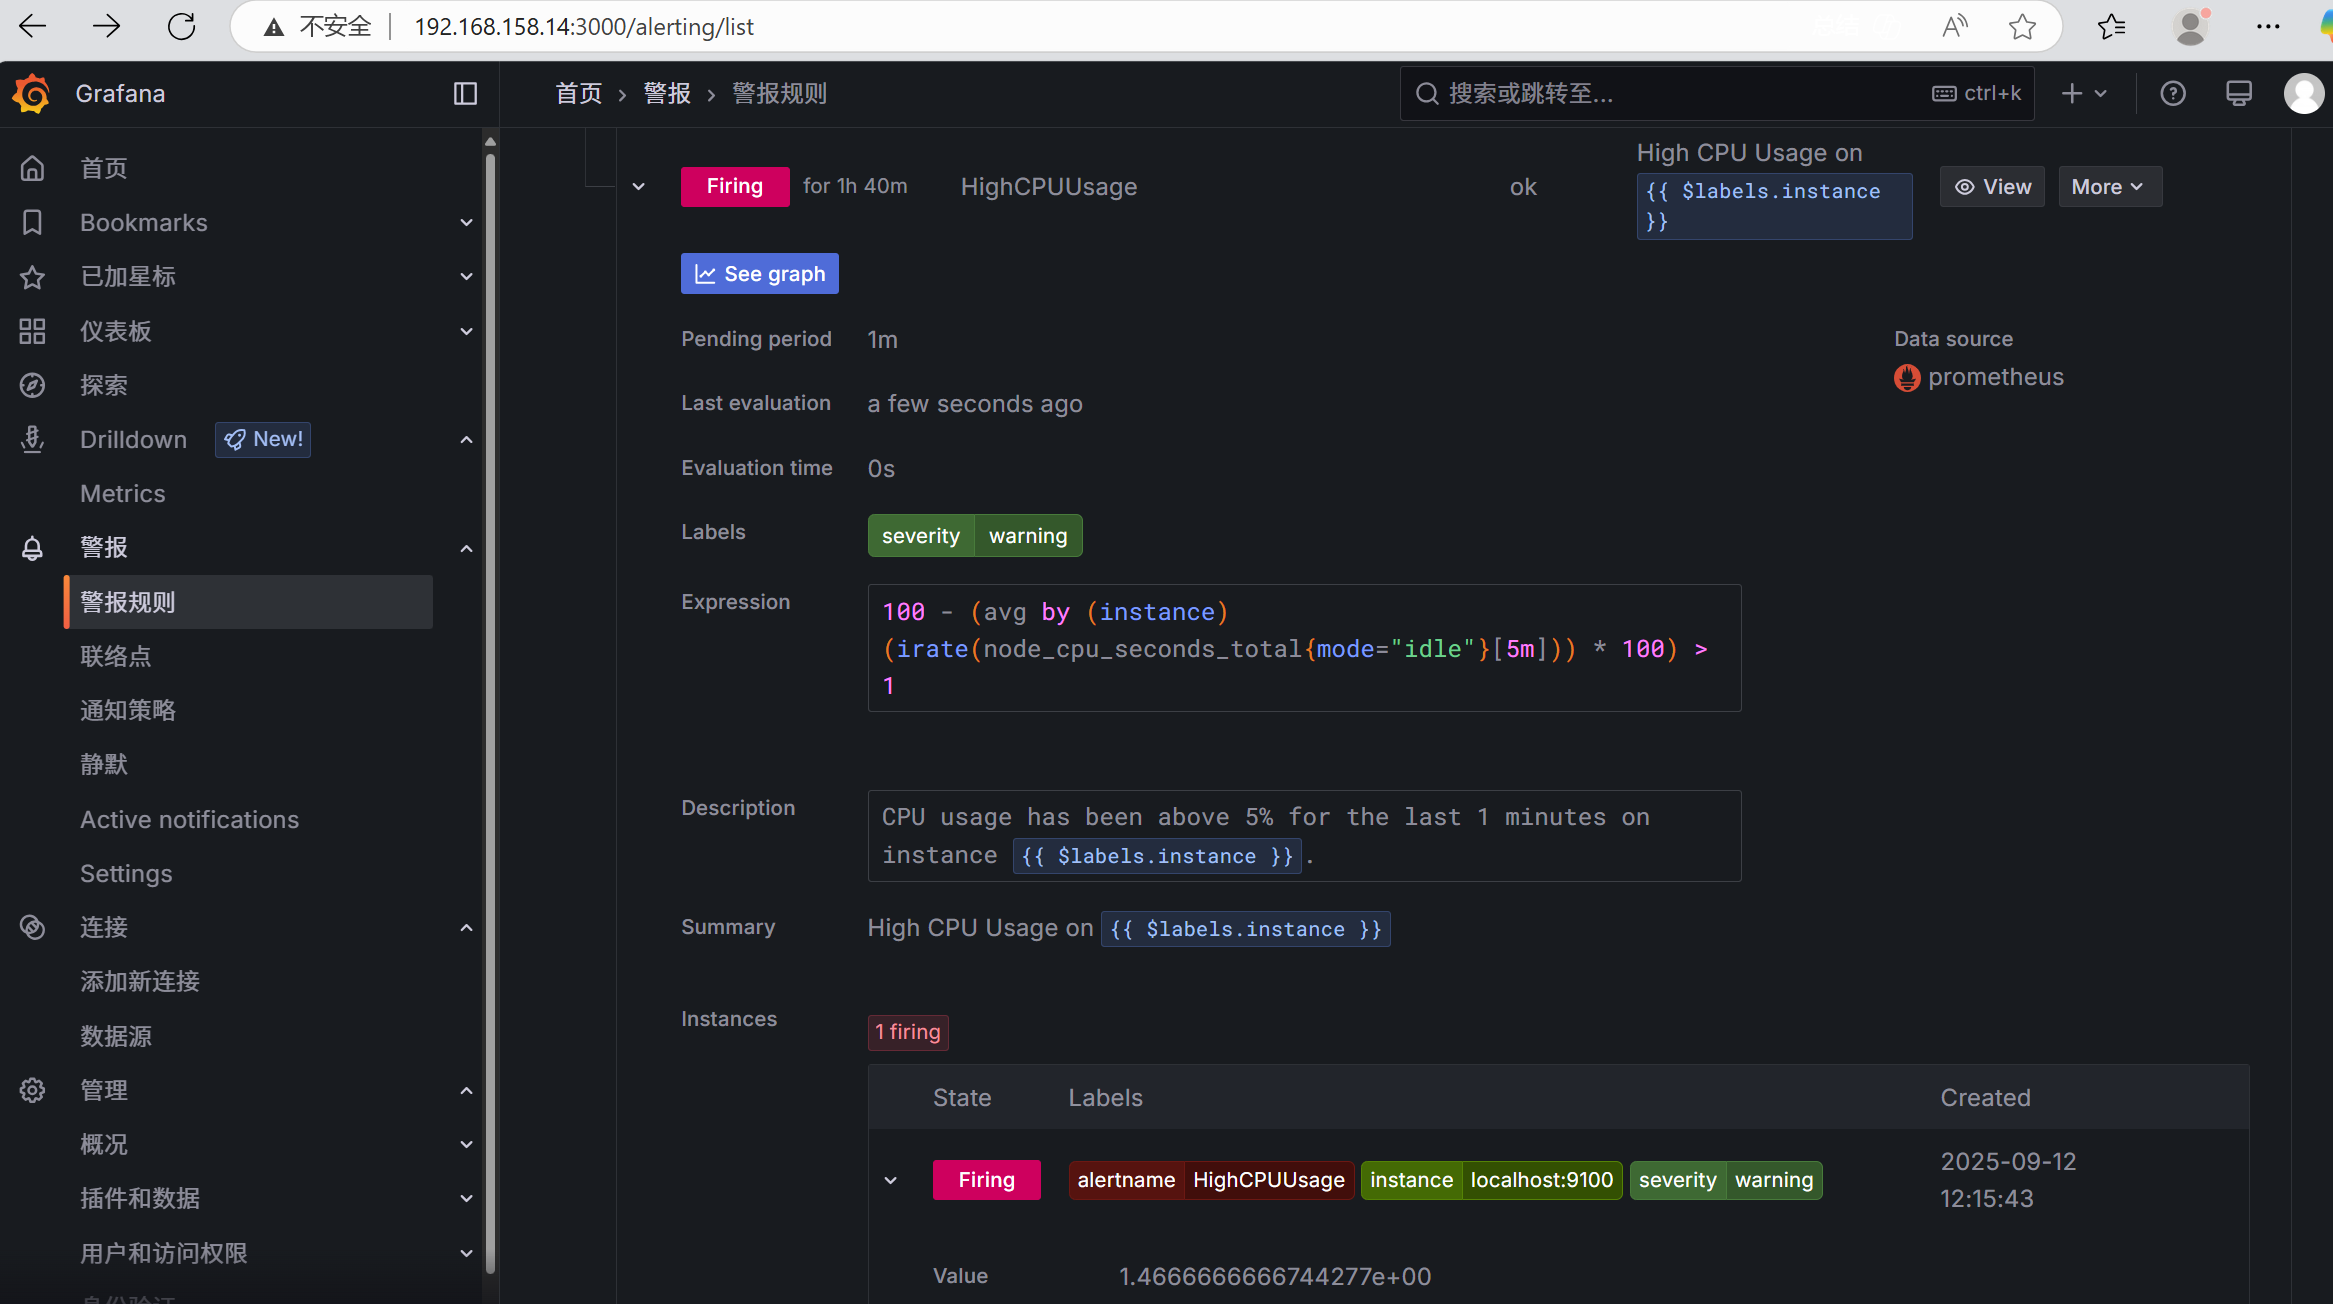
- alert: HighCPUUsage
expr: 100 - (avg by (instance) (irate(node_cpu_seconds_total{mode="idle"}[5m])) * 100) > 5
for: 2m
labels:
severity: warning
annotations:
summary: "High CPU Usage on {{ $labels.instance }}"
description: "CPU usage has been above 5% for the last 2 minutes on instance {{ $labels.instance }}."重启alertmanager
[root@prometheus alertmanager]# killall alertmanager
[root@prometheus alertmanager]# ls
alertmanager  alertmanager.yml  alertmanager.yml.back  amtool  data  LICENSE  nohup.out  NOTICE
[root@prometheus alertmanager]# nohup ./alertmanager --web.listen-address=:9093 --config.file=/usr/local/alertmanager/alertmanager.yml &
[1] 353821
[root@prometheus alertmanager]# nohup: 忽略输入并把输出追加到 'nohup.out'
[root@prometheus alertmanager]# netstat -anptu | grep 9093
tcp6       0      0 :::9093                 :::*                    LISTEN      353821/./alertmanag
让配置生效
重启prometheus
[root@prometheus prometheus]# killall prometheus[root@prometheus rules]# !nohup
nohup prometheus --config.file=/usr/local/prometheus/prometheus.yml &
[7] 327395
[root@prometheus rules]# nohup: 忽略输入并把输出追加到 'nohup.out'
查看prometheus与alertmanager是否正常连接
如果prometheus没有与alertmanager连接,是无法触发报警规则
[root@prometheus prometheus]# netstat -anptu | grep 9093
tcp6       0      0 :::9093                 :::*                    LISTEN      353821/./alertmanag
tcp6       0      0 ::1:52844               ::1:9093                ESTABLISHED 361039/prometheus
tcp6       0      0 ::1:9093                ::1:52844               ESTABLISHED 353821/./alertmanag
这里可以看到prometheus端口号52844与alertmanager的9093端口正常连接

验证测试告警
执行下方命令,使cpu使用率触发告警规则
这是一条 无限循环 的 Bash shell 命令。
它的作用是:在终端屏幕上持续地、不间断地重复输出一行一行的数字 111
[root@prometheus prometheus]# while true;do echo 111;done回到监控页面
绿色(正常)>黄色>红色(触发告警规则)
查看邮箱