《------往期经典推荐------》
二、机器学习实战专栏【链接】,已更新31期,欢迎关注,持续更新中~~
三、深度学习【Pytorch】专栏【链接】
四、【Stable Diffusion绘画系列】专栏【链接】
五、YOLOv8改进专栏【链接】,持续更新中~~
六、YOLO性能对比专栏【链接】,持续更新中~
《------正文------》
引言
在机器学习领域,手写数字识别是一个经典的应用案例,经常被用来测试和演示图像识别算法的有效性。本篇文章将通过实际代码示例,详细介绍如何使用Python编程语言和支持向量机(SVM)分类器来识别手写数字。我们将一步步地从数据的导入和预处理,到模型的训练、评估,以及参数调优。
实现步骤
导入必要的库
开始之前,需要导入数据处理和机器学习所需的库,包括numpy、pandas、sklearn等。
import numpy as np
import pandas as pd
import os
from PIL import Image
from sklearn.model_selection import train_test_split
from sklearn.svm import SVC
from sklearn.metrics import classification_report, accuracy_score, confusion_matrix
import matplotlib.pyplot as plt
加载数据集
数据集存放在特定的目录结构中,每个数字一个文件夹,我们将遍历这些文件夹加载图像。
base_dir = "/hand-written-numbers"
folders = ["0", "1", "2", "3", "4", "5", "6", "7", "8", "9"]
data = []
for folder in folders:
    folder_path = os.path.join(base_dir, folder)
    for filename in os.listdir(folder_path):
        if filename.endswith(('.jpg', '.png', '.jpeg')):
            img_path = os.path.join(folder_path, filename)
            image = Image.open(img_path).convert('L')  # 转换为灰度图像
            image_array = np.array(image)
            image_flatten = image_array.flatten()
            image_array = np.resize(image_array, (28, 28))  # 调整图像大小
            label = int(folder)
            data.append((image_flatten, label))
数据预处理
将数据集转换为Pandas DataFrame,并进行洗牌和划分训练集与测试集。
df = pd.DataFrame(data, columns=['image', 'label'])
df = df.sample(frac=1).reset_index(drop=True)  # 随机打乱数据
X = df['image'].values
y = df['label'].values
X_train, X_test, y_train, y_test = train_test_split(X, y, test_size=0.2, random_state=42)
X_train = X_train / 255  # 归一化处理
X_test = X_test / 255
定义SVM模型
创建一个包含不同核函数的SVM模型列表,以便于后续的训练和评估。
models = [
    {'name': 'Linear SVM', 'model': SVC(kernel='linear', random_state=42)},
    {'name': 'Polynomial SVM (degree 3)', 'model': SVC(kernel='poly', degree=3, random_state=42)},
    {'name': 'RBF SVM', 'model': SVC(kernel='rbf', random_state=42)},
    {'name': 'Sigmoid SVM', 'model': SVC(kernel='sigmoid', random_state=42)}
]
训练和评估模型
定义一个函数来训练和评估每个SVM模型,打印出分类报告和混淆矩阵。
def evaluate_models(models, X_train, y_train, X_test, y_test):
    for item in models:
        model = item['model'].fit(X_train, y_train)
        y_pred = model.predict(X_test)
        print(f"\n{item['name']} Classification Report:")
        print(classification_report(y_test, y_pred))
        conf_matrix = confusion_matrix(y_test, y_pred)
        disp = ConfusionMatrixDisplay(conf_matrix)
        disp.plot(cmap=plt.cm.Blues)
        plt.title(f'Confusion Matrix: {item["name"]}')
        plt.show()

evaluate_models(models, X_train, y_train, X_test, y_test)


通过上述结果我们可以看到,此数据集使用ploy与rbf核函数得到的效果最好,准确率可以达到96%。
参数调优
使用GridSearchCV进行参数调优,以找到最佳的SVM模型参数。
from sklearn.model_selection import GridSearchCV

param_grid = {
    'C': [0.1, 1, 10, 100],
    'kernel': ['linear', 'poly', 'rbf', 'sigmoid'],
    'degree': [3, 5]  # 仅对多项式核有效
}
grid_search = GridSearchCV(SVC(random_state=42), param_grid, cv=5, n_jobs=-1)
grid_search.fit(X_train, y_train)
best_params = grid_search.best_params_
print("Best Parameters from Grid Search:")
print(best_params)
使用最佳模型进行预测
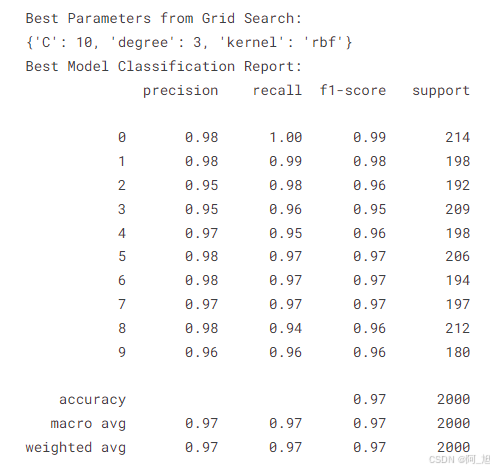
使用网格搜索找到的最佳参数,评估模型的性能。
best_model = grid_search.best_estimator_
y_pred = best_model.predict(X_test)
print("Best Model Classification Report:")
print(classification_report(y_test, y_pred))

from sklearn.metrics import ConfusionMatrixDisplay, confusion_matrix
from sklearn.model_selection import cross_val_predict
import matplotlib.pyplot as plt


# Make cross-validated predictions on the training set
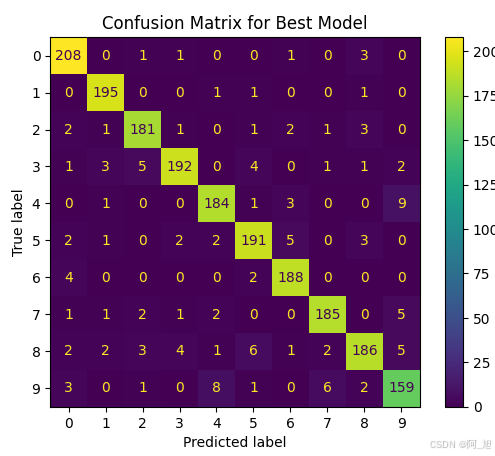
y_test_pred = cross_val_predict(best_model, X_test, y_test, cv=3)

# Compute and display the confusion matrix
ConfusionMatrixDisplay.from_predictions(y_test, y_test_pred)
plt.title('Confusion Matrix for Best Model')
plt.show()

accuracy = accuracy_score(y_test, y_pred)
print(f"Accuracy of best SVM on MNIST: {accuracy:.2f}")

结果展示:
每个SVM模型的性能通过分类报告和混淆矩阵进行了展示。最终,通过网格搜索得出的最佳模型在测试集上的准确率达到了97%。
结论
通过本篇文章的实战演练,我们成功地使用Python和SVM分类器完成了手写数字识别任务。我们不仅训练和评估了不同核函数的SVM模型,还通过网格搜索优化了模型参数,最终找到了最佳模型,展示了SVM在图像识别任务中的有效性。
总结
本文以“步骤 + 代码”的形式,详细地介绍了使用Python和SVM进行手写数字识别的全过程。每个步骤都配有相应的代码和解释,使读者能够跟随操作并理解每一步的目的和效果。通过实际的代码实现,我们不仅学习了如何加载和预处理数据,还掌握了如何训练模型、评估性能以及进行参数调优,为读者提供了一个完整的机器学习项目示例。
好了,这篇文章就介绍到这里,如果对你有帮助,感谢点赞关注!