1 刻度轴的设置
本小节介绍 如何设置刻度的颜色、长度、生长方向以及将正上方的刻度隐藏掉,还有设置刻度文本的颜色Scale.FontSpec.FontColor。
            Color axisColor = Color.FromArgb(150, 150, 150);
            #region X轴
            //设置主刻度的长度
            this.zedGraph.GraphPane.XAxis.MajorTic.Size = 30f;
            //主刻度颜色  黄色
            this.zedGraph.GraphPane.XAxis.MajorTic.Color = Color.Yellow;

            //子刻度颜色   靛青色
            this.zedGraph.GraphPane.XAxis.MinorTic.Color = Color.Cyan;
            this.zedGraph.GraphPane.XAxis.MinorTic.Size = 10f;

            //设置X轴颜色
            this.zedGraph.GraphPane.XAxis.Color = axisColor;
            //设置刻度文本颜色
            this.zedGraph.GraphPane.XAxis.Scale.FontSpec.FontColor = axisColor;
            //设置X轴标题颜色
            this.zedGraph.GraphPane.XAxis.Title.FontSpec.FontColor = axisColor;

            #endregion
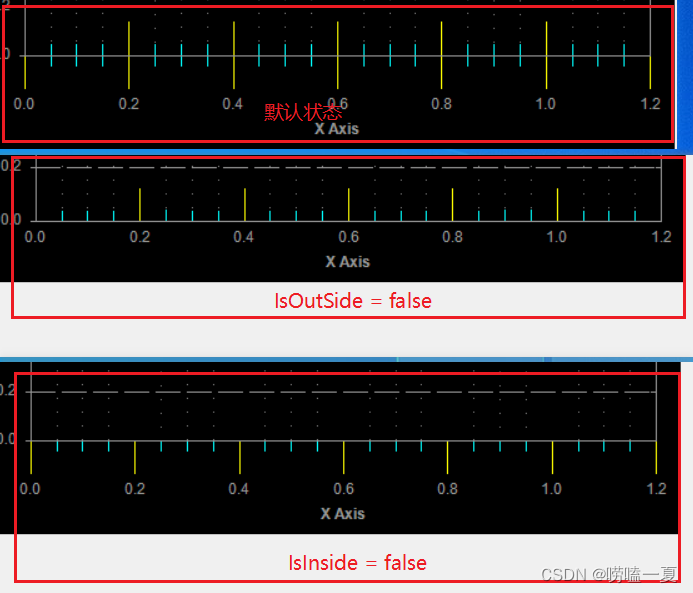
如图所示:黄色且比较长的是主刻度,靛青色且较短的是子刻度

看到上方也有刻度的存在,不符合常理,那我们把它隐藏掉吧。设置IsOpposite = false,即可隐藏
            //隐藏X轴正上方的刻度
            //隐藏主刻度
            this.zedGraph.GraphPane.XAxis.MajorTic.IsOpposite = false;
            //隐藏子刻度
            this.zedGraph.GraphPane.XAxis.MinorTic.IsOpposite = false;

接下来设置刻度的朝向,只向里面或只向外边,设置IsOutside或IsInside的属性值。
          //不朝外
          this.zedGraph.GraphPane.XAxis.MajorTic.IsOutside = false;
          this.zedGraph.GraphPane.XAxis.MinorTic.IsOutside = false;

            //不朝里头
           // this.zedGraph.GraphPane.XAxis.MajorTic.IsInside = false;
          //  this.zedGraph.GraphPane.XAxis.MinorTic.IsInside = false;
2 网格线的设置
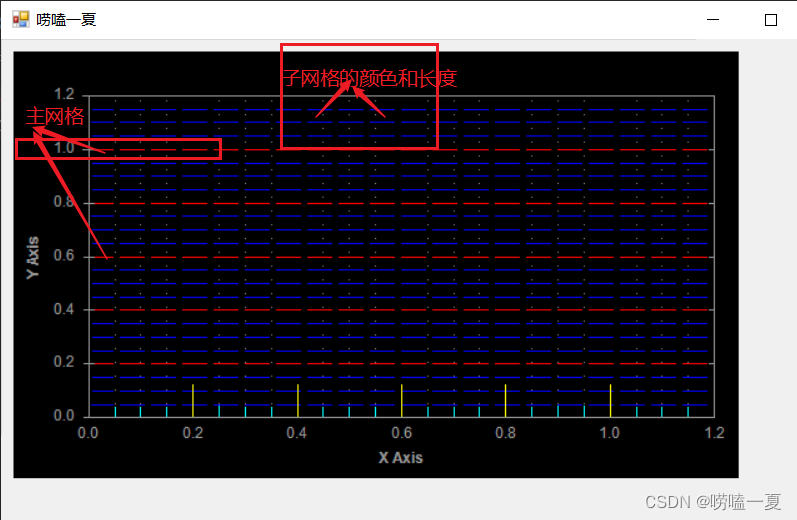
网格线的设置与刻度轴的设置类似,也有主和次之分。
下面设置Y轴的主网格线为红色,使用点实线绘制,并设置了实线长度为20,虚线(空)的长度为5,子网格线使用蓝色绘制
            //设置网格线 主网格线
            this.zedGraph.GraphPane.YAxis.MajorGrid.IsVisible = true;
            //设置主网格线 为红色
            this.zedGraph.GraphPane.YAxis.MajorGrid.Color = Color.Red;

             //实线长度为20
            this.zedGraph.GraphPane.YAxis.MajorGrid.DashOn = 20f;
             //空白长度为5
            this.zedGraph.GraphPane.YAxis.MajorGrid.DashOff = 5f;
            this.zedGraph.GraphPane.YAxis.MajorGrid.PenWidth = 0.1f;
            //子网格线
            this.zedGraph.GraphPane.YAxis.MinorGrid.IsVisible = true;
            this.zedGraph.GraphPane.YAxis.MinorGrid.Color = Color.Blue;
            this.zedGraph.GraphPane.YAxis.MinorGrid.DashOn = 20f;
            this.zedGraph.GraphPane.YAxis.MinorGrid.DashOff = 5f;
3 制作一个好看的背景
上面的颜色是不是太花里胡哨了(主要是为了好区分主次刻度以及其它属性),下面我们做一个黑色色调的,好看一点的。
首先,背景是黑色的;其次,网格线和X轴的刻度都是灰色的;Y轴及Y轴的刻度和文本都是黄色的。
        private void InitPlot()
        {
            //去掉外边框
            this.zedGraph.GraphPane.Border.IsVisible = false;

            //设置黑色
            this.zedGraph.GraphPane.Fill = new ZedGraph.Fill(Color.Black);

            //设置曲线区域的矩形框的颜色
            this.zedGraph.GraphPane.Chart.Fill = new ZedGraph.Fill(Color.Black);

            //设置绘制曲线区域的矩形框的边框颜色
              this.zedGraph.GraphPane.Chart.Border.Color = Color.FromArgb(150, 150, 150);

            //灰色
            Color axisColor = Color.FromArgb(150, 150, 150);
            float dashLength = 4f;

            #region X轴
            //设置网格线 主网格线
            this.zedGraph.GraphPane.XAxis.MajorGrid.IsVisible = true;
            this.zedGraph.GraphPane.XAxis.MajorGrid.Color = axisColor;
            this.zedGraph.GraphPane.XAxis.MajorGrid.DashOn = dashLength;
            this.zedGraph.GraphPane.XAxis.MajorGrid.DashOff = dashLength;
            this.zedGraph.GraphPane.XAxis.MajorGrid.PenWidth = 0.1f;
            //子网格线 不可见
            this.zedGraph.GraphPane.XAxis.MinorGrid.IsVisible = false;

            //刻度
            //设置主刻度的长度
            this.zedGraph.GraphPane.XAxis.MajorTic.Size = 10f;
            //主刻度颜色
            this.zedGraph.GraphPane.XAxis.MajorTic.Color = axisColor;

            //隐藏X轴正上方的刻度
            this.zedGraph.GraphPane.XAxis.MajorTic.IsOpposite = false;
            this.zedGraph.GraphPane.XAxis.MinorTic.IsOpposite = false;

            //朝外
            this.zedGraph.GraphPane.XAxis.MajorTic.IsInside = false;
            this.zedGraph.GraphPane.XAxis.MinorTic.IsInside = false;


            //设置刻度文本颜色
            this.zedGraph.GraphPane.XAxis.Scale.FontSpec.FontColor = axisColor;
            //设置X轴标题颜色
            this.zedGraph.GraphPane.XAxis.Title.FontSpec.FontColor = axisColor;
            //设置X轴颜色
            this.zedGraph.GraphPane.XAxis.Color = axisColor;

            #endregion

            #region Y轴
            //设置网格线 主网格线
            this.zedGraph.GraphPane.YAxis.MajorGrid.IsVisible = true;
            this.zedGraph.GraphPane.YAxis.MajorGrid.Color = axisColor;
            this.zedGraph.GraphPane.YAxis.MajorGrid.DashOn = dashLength;
            this.zedGraph.GraphPane.YAxis.MajorGrid.DashOff = dashLength;
            this.zedGraph.GraphPane.YAxis.MajorGrid.PenWidth = 0.1f;
            //设置子网格线不可见
            this.zedGraph.GraphPane.YAxis.MinorGrid.IsVisible = false;


            Color ycolor = Color.Yellow;

            //刻度
            //设置主刻度的长度
            this.zedGraph.GraphPane.YAxis.MajorTic.Size = 10f;
            //主刻度颜色
            this.zedGraph.GraphPane.YAxis.MajorTic.Color = ycolor;
            //设置对面的Y轴刻度不可见
            this.zedGraph.GraphPane.YAxis.MajorTic.IsOpposite = false;

            //朝内
            this.zedGraph.GraphPane.YAxis.MajorTic.IsOutside = false;
            this.zedGraph.GraphPane.YAxis.MinorTic.IsOutside = false;


            //设置Y轴颜色
            this.zedGraph.GraphPane.YAxis.Color = ycolor;
            //设置刻度文本颜色
            this.zedGraph.GraphPane.YAxis.Scale.FontSpec.FontColor = ycolor;
            //设置X轴标题颜色
            this.zedGraph.GraphPane.YAxis.Title.FontSpec.FontColor = ycolor;

            #endregion
        }
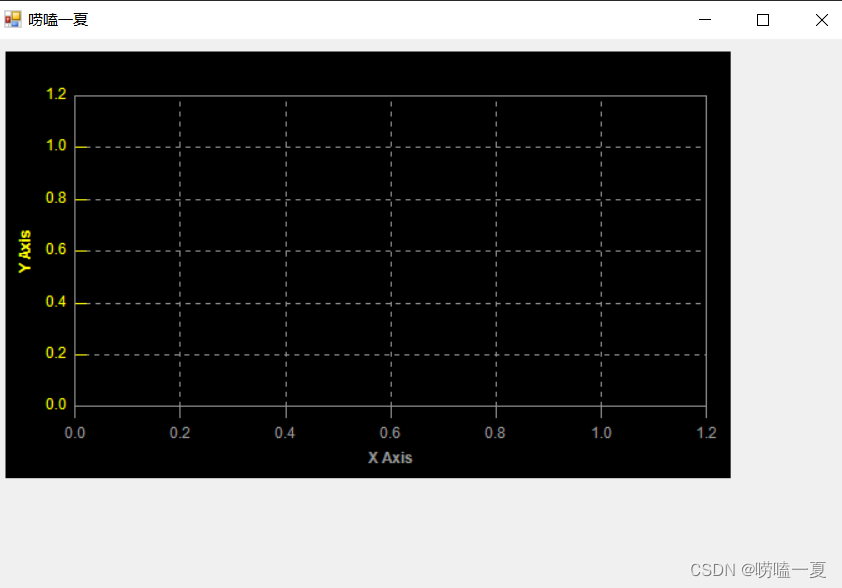
设置文本标签的显示方向
默认的Y轴标题是倒着显示的,如何让文本横向显示呢?设置一下Angle 属性。
//设置标题的角度
 this.zedGraph.GraphPane.YAxis.Title.FontSpec.Angle = 90;

4 总结
Axis轴包含一下类,也提供了访问以下类的实例接口:
 MajorGrid: 主网格
 MinorGrid:子网格

 MajorTic: 主刻度
 MinorTic: 子刻度
 Scale:    刻度轴
 Title:      标题
本文含有隐藏内容,请 开通VIP 后查看